
Figures & data
Table 1 Attributes and levels included in the scenarios
Table 2 Patient sociodemographic and clinical variables
Table 3 Number and percentage of patients receiving treatment with BAs at the time of study inclusion, and previous treatment
Figure 1 Patients’ (A) and rheumatologists’ (B) utility values.
Note: Estimated utility values for each attribute in the sample of patients and rheumatologists.
Abbreviation: AEs, adverse events.
Abbreviation: AEs, adverse events.
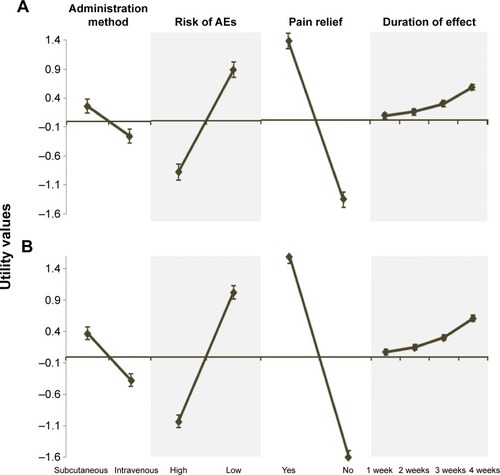
Figure 2 Relative importance values given by both patients and rheumatologists to the attributes of biological agents and for specific rheumatic conditions.
Abbreviations: RA, rheumatoid arthritis; AS, ankylosing spondylitis; PsA, psoriatic arthritis.
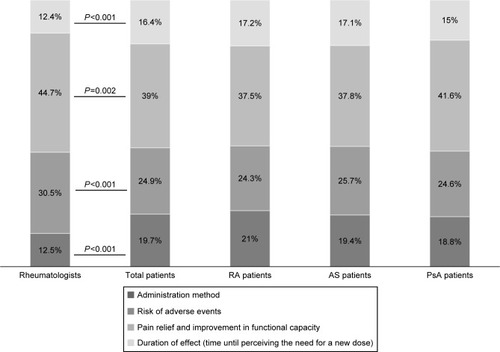
Figure 3 Pareto diagrams representing patients’ and professionals’ utility values for subcutaneous and intravenous treatment alternatives.
Notes: (A) Utility values for patients regarding subcutaneous treatment. (B) Utility values for patients regarding intravenous treatment. (C) Utility values for professionals regarding subcutaneous treatment. (D) Utility values for professionals regarding intravenous treatment. Duration of effect indicates the time until perceiving the need for a new dose (1 week, 4 weeks, and 8 weeks).
Abbreviations: AEs, adverse events; BA, biological agent.
Abbreviations: AEs, adverse events; BA, biological agent.
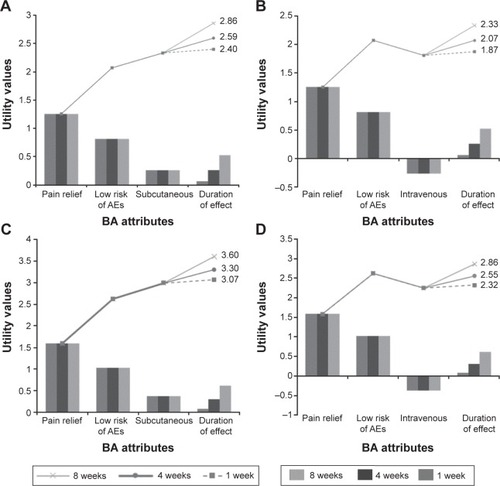
Table 4 Factors influencing patients’ and rheumatologists’ preferencesTable Footnotea