
Figures & data
Figure 1 Inclusion–exclusion criteria and sample size.
Notes: Identification window defined as July 1, 2010 through June 30, 2011. Index date defined as first receipt of GLA in identification window. Preperiod defined as 1 year prior to index date. Postperiod defined as 3 years plus index date.
Abbreviations: GLA, glucose-lowering agent; T2D, type 2 diabetes.
Abbreviations: GLA, glucose-lowering agent; T2D, type 2 diabetes.
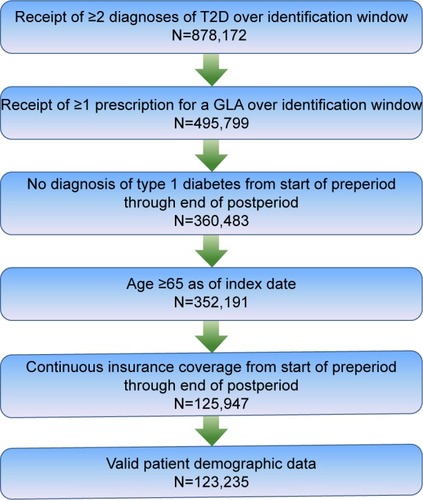
Table 1 Descriptive statistics
Figure 2 All-cause costs: by adherence levels.a
Note:
at-Tests comparing component costs across alternative thresholds were all statistically significant (P<0.05).
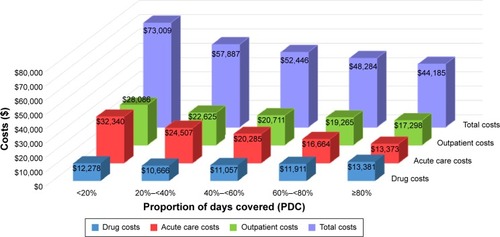
Figure 3 Diabetes-related costs: by adherence levels.a
Note:
at-Tests comparing component costs across alternative thresholds were all statistically significant (P<0.05) except: diabetes-related total costs with adherence level 60%–<80% compared to adherence level ≥80%.
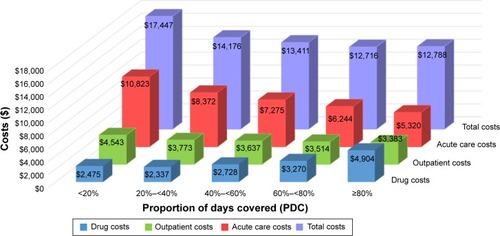
Table 2 Resource utilization and complications: by adherence levelsTable Footnotea