
Figures & data
Table 1 Risk levels for total cholesterol
Table 2 Risk levels for high density lipoprotein
Table 3 Blood pressure range according to age
Table 4 BMI range
Figure 1 Activity diagram of proposed system.
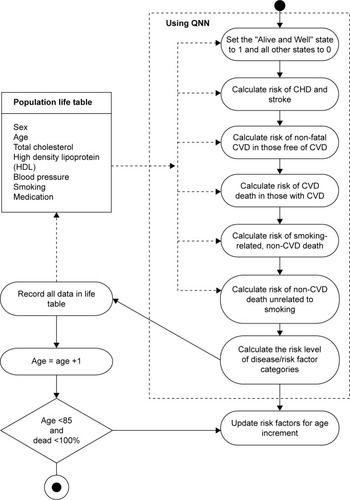
Table 5 Forecast of number of cases (both male and female) of CVD in India
Table 6 Input parameters
Figure 2 Architecture of quantum neural network.
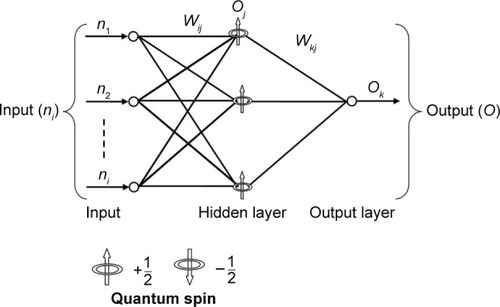
Figure 3 Flowchart of quantum neural network for heart disease prediction system.
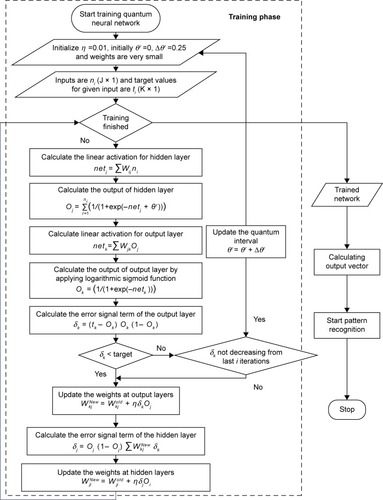
Table 7 Data partition set
Table 8 Percentage level of risk categories
Table 9 Baseline value of parameters
Table 10 Percentage-wise patient distribution for various risk factors
Table 11 Percentage-wise patient distribution for smoking and being on medication
Table 12 Comparison of the results of the proposed algorithm with similar algorithms
Figure 4 Graph showing accuracy of proposed system and Framingham risk score (FRS).
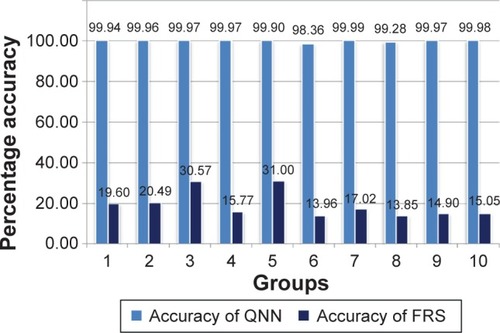
Table 13 Data showing comparison of the proposed system and FRS of random testing on different experimental values
Table 14 Validation based on the dataset from the Framingham study of 5,209 American CVD patients