
Figures & data
Table 1 Attributes and levels for the discrete choice experiment
Table 2 Self-reported sociodemographic and clinical characteristics
Table 3 Part-worth utilities, relative importance, and rankings of attributes in overall sample
Figure 1 Relative importance of attributes in overall sample.
Abbreviations: RI, relative importance; HbA1c, hemoglobin A1c.
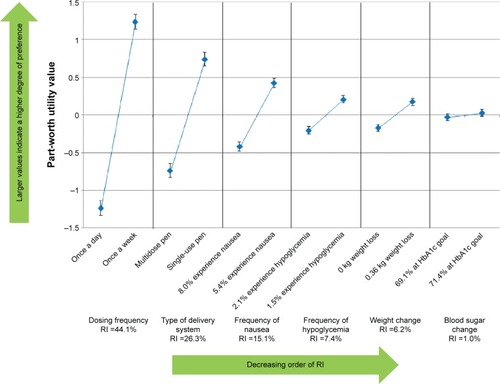
Figure 2 Relative importance of attributes by sex.
Notes: *Statistically significant difference between sexes in preference for levels of the attribute (P<0.05). †Statistically significant difference in the RI of each attribute across sex (P<0.0001).
Abbreviations: RI, relative importance; HbA1c, hemoglobin A1c.
Abbreviations: RI, relative importance; HbA1c, hemoglobin A1c.
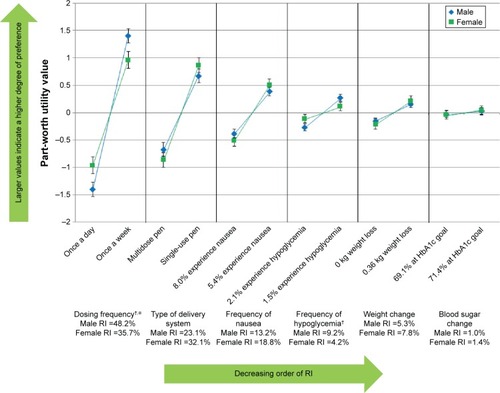
Figure 3 Relative importance of attributes by age group (<60 years vs ≥60 years).
Note: *Statistically significant difference between age groups in preference for levels of the attribute (P<0.05).
Abbreviations: RI, relative importance; HbA1c, hemoglobin A1c.
Abbreviations: RI, relative importance; HbA1c, hemoglobin A1c.

Table 4 Patients’ poststudy willingness to take medications described by the dulaglutide and liraglutide medication profiles (N=182)
Table 5 Comparison of attributes and levels for the UK and Japanese discrete choice experiments