
Figures & data
Figure 1 Definition of persistence in base case (60 days medication gap).
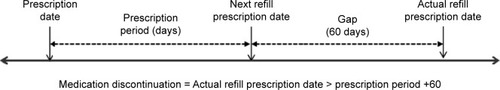
Figure 2 Study population.
Note: Data are presented as n (%) unless indicated.
Abbreviations: DMARDs, disease-modifying antirheumatic drugs; RA, rheumatoid arthritis.
Abbreviations: DMARDs, disease-modifying antirheumatic drugs; RA, rheumatoid arthritis.
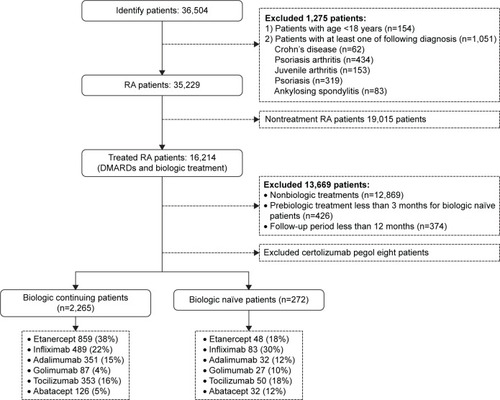
Table 1 Characteristics of biologic-naïve and -continuing patients
Figure 3 Kaplan–Meier curves for biologic agent patients.
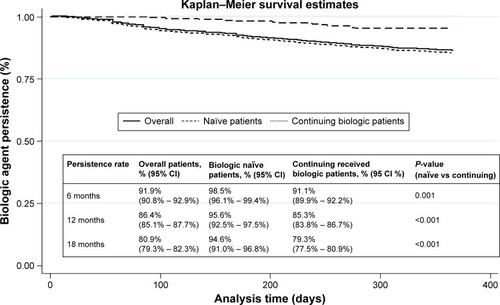
Figure 4 Kaplan–Meier curves of naïve biologic agent patients.
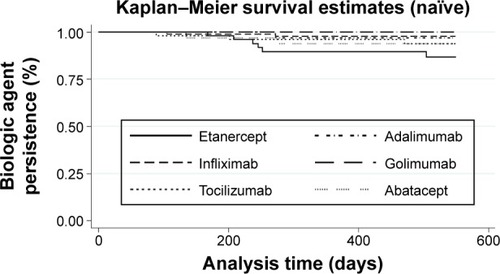
Table 2 Persistence rates and 95% CIs
Table 3 P-values of log rank tests
Table 4 Cox regression
Table 5 Persistence rates (%) and 95% CIs of biologic-naïve patients for 30- and 120-day gap definition
Table 6 Parametric regression (Weibull distribution with 60 days gap definition)