
Figures & data
Table 1 Demographic characteristics of public and pharmacist respondents
Table 2 Agreement with desirability of different attributes of pharmacies, staff, and practices expressed by the public and community pharmacists
Table 3 Differences in public preferences for aspects of pharmacy characteristics and practices dependent on the use of medicines and pharmacies
Table 4 Views expressed by the public and pharmacists on attributes perceived as important in choosing a pharmacy and promotion of services
Figure 1 Proportions of public and pharmacist respondents indicating agreement that promotional methods are effective in encouraging service uptake.
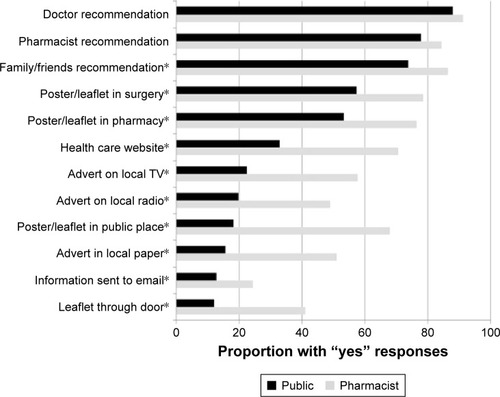
Table 5 Public preferences for promotional methods for pharmacy medicine-related services related to respondent characteristics
Table 6 Odds ratio (95% CI) of public views toward promotional methods for medicine-related services