Figures & data
Table 1 Demographic characteristics of physicians and patients
Figure 1 Preference weights for first series of choice questions for physicians.
Abbreviations: CI, confidence interval; EPS, extrapyramidal symptoms; N, number of respondents who answered the question.
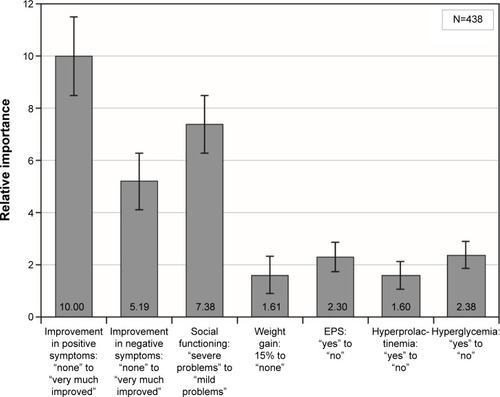
Figure 2 Preference weights for first series of choice questions for patients.
Abbreviations: CI, confidence interval; EPS, extrapyramidal symptoms; N, number of respondents who answered the question.
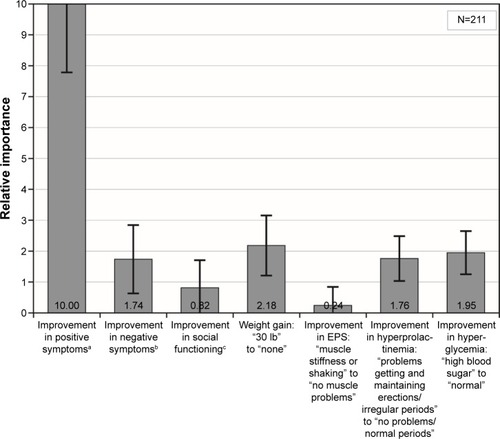
Figure 3 Relative importance assigned by physicians in second series of choice questions.
Abbreviations: CI, confidence interval; EPS, extrapyramidal symptoms; N, number of respondents who answered the question.
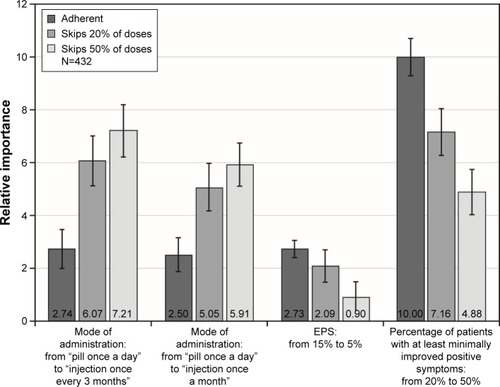
Figure 4 Relative importance assigned by patients to second series of choice questions.
Abbreviations: CI, confidence interval; N, number of respondents who answered the question.
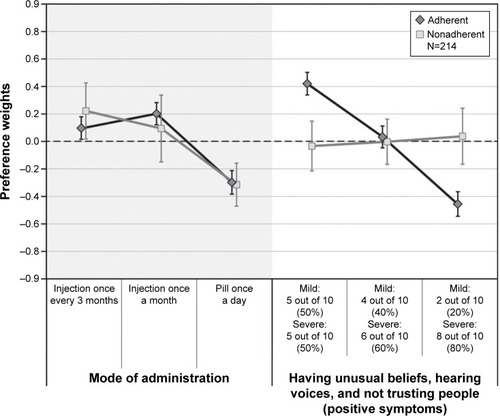
Figure S1 Example of physician discrete-choice question (first set).
Abbreviation: EPS, extrapyramidal symptoms.
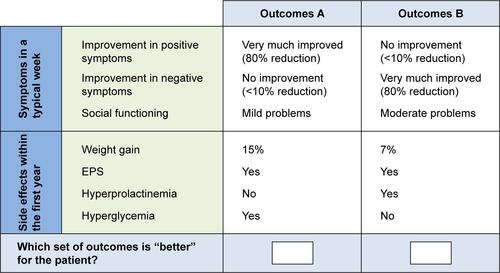
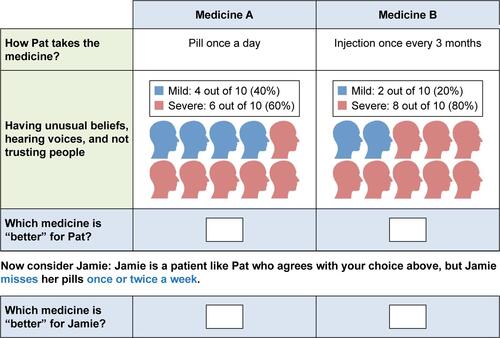
Figure S2 Example of patient (female) discrete-choice question (first set).
Abbreviation: Pat, patient.
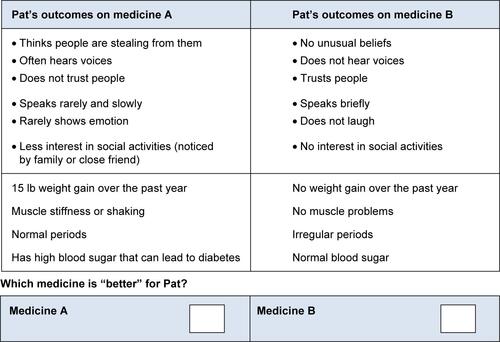
Figure S3 Example of patient (male) discrete-choice question (first set).
Abbreviation: Pat, patient.
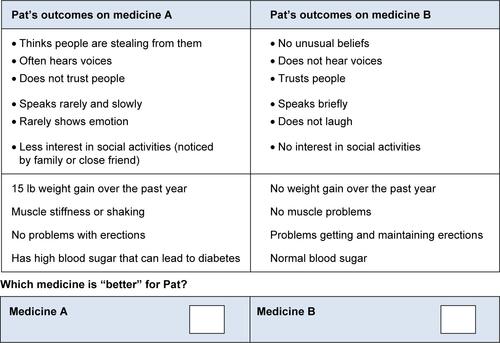
Figure S4 Example of physician formulation question with follow-up adherence information (second set).
Abbreviation: EPS, extrapyramidal symptoms.
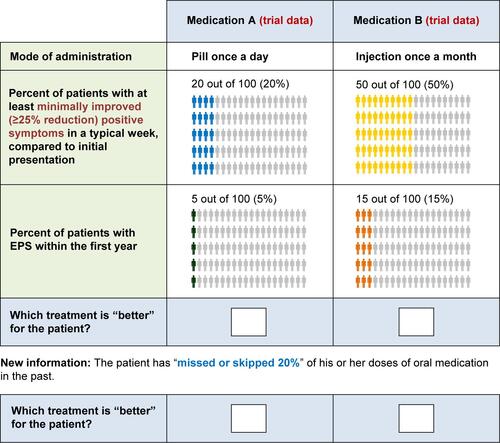
Figure S5 Example of patient formulation question with follow-up adherence information (second set).
Notes: Medicines are the same except as shown in the figure. Pat typically never misses taking her medicine.
Abbreviation: Pat, patient.