
Figures & data
Figure 1 Histogram of hypertension knowledge scores obtained by 233 patients.
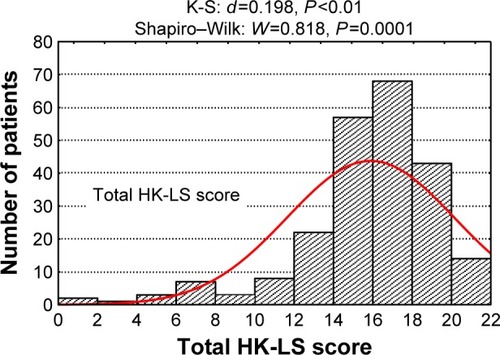
Table 1 Respondents’ sociodemographic characteristics in relation to their knowledge level
Table 2 Respondents’ clinical characteristics in relation to knowledge level
Table 3 Number (proportions) of correct answers to HK-LS items in the two hypertension knowledge level subgroups
Figure 2 Comparison of correct answer proportions for each HK-LS item in the two groups differentiated by their level of knowledge on hypertension (items with <50% correct answers are marked in red).
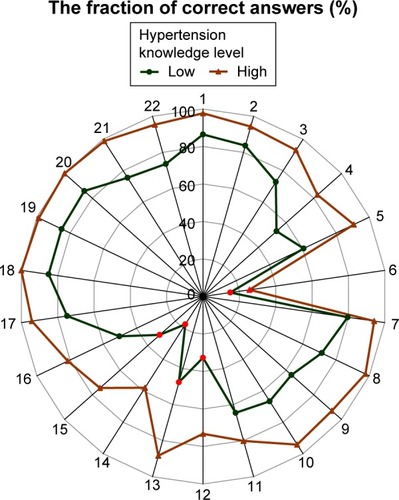
Figure 3 Comparison of correct answer percentages in the 6 HK-LS domains between the two groups differentiated by their level of knowledge on hypertension.
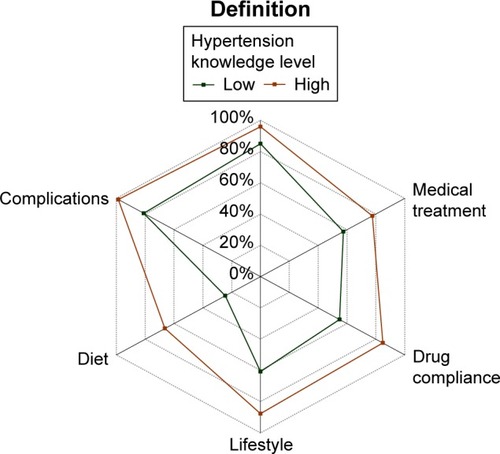
Table 4 Proportions of correct answers in HK-LS domains for the two subgroups
Table 5 Single- and multiple-factor regression analysis results for the variables studied against MMAS scores
Table 6 Spearman’s rank correlation coefficients (ρ) and significance values (P) for correlations between HK-LS domains and MMAS-8 scores