
Figures & data
Table 1 Change in level of patients’ access to their own medical file per organization (percentages)
Table 2 Organizations and their safeguarding of patients’ interests, before and after the intervention (percentages)
Table 3 Patient involvement before and after the intervention (percentages)
Table 4 Weighing of the importance of subdomains within the domain patient-centeredness by two expert panels
Figure 1 Flowchart of inclusion and intervention in care groups and outpatient clinics.
Note: The number of outpatient clinics are represented within parentheses.
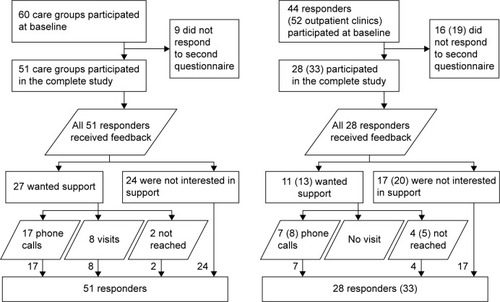
Table 5 Quality management scores regarding patient-centeredness and its subdomains, at baseline and after the intervention (percentages)