
Figures & data
Table 1 Basic characteristics of the respondents
Table 2 Health information
Table 3 Patients’ attitude to data recording and personal monitoring
Table 4 Absolute and relative frequency of smartphone owners according to the type of diabetes
Figure 1 Relative frequency of using modern devices.
Abbreviation: CGM, continuous glucose monitoring.
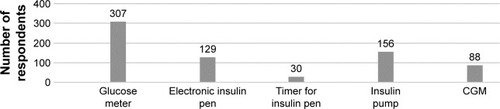
Table 5 Overview of testing hypothesis (comparing T2DM and T1DM)
Table 6 Overview of testing hypothesis (comparing patients with/without complication)
Table 7 Overview of testing hypothesis