
Figures & data
Figure 1 UPS-EP tools (Swedish version).

Figure 2 Regression models for the factors influencing the three key steps of USP-EP.
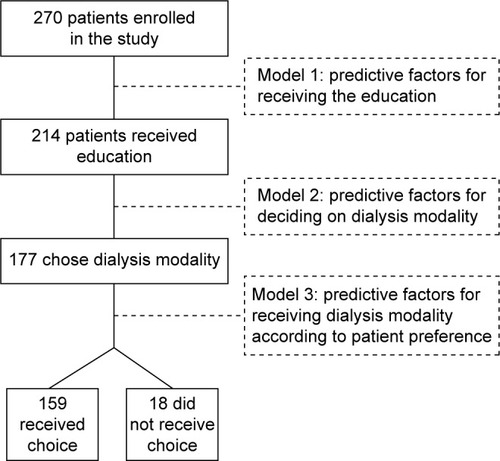
Table 1 Logistic regression analysis evaluating the predictors of receiving education in 270 UPS patients
Table 2 Logistic regression analysis evaluating the predictors of making the choice on dialysis modality after receiving education in 214 UPS patients
Table 3 Logistic regression analysis evaluating the predictors of receiving dialysis modality according to patient preferred choice (n=159) versus not receiving preferred dialysis modality according to patient choice (n=18) following completion of UPS-EP
Table 4 Dialysis modality costs according to preferred modality choice following UPS (n=177), actual modality received by these patients, and calculated costs derived for usual care modality distribution