
Figures & data
Table 1 Benefits (for patients and organization) attributed to high level of engagement of employees in the treatment process
Table 2 Demographic data
Figure 1 Explanation of how the drug therapy works and its possible side effects.
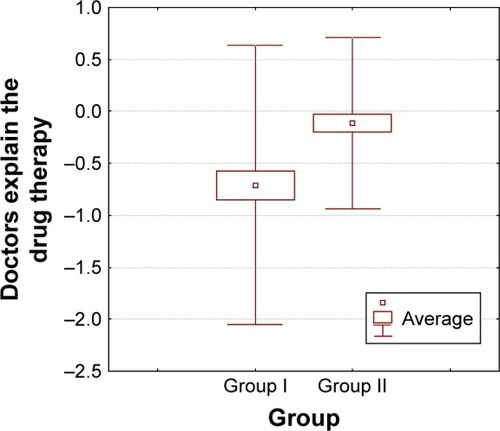
Figure 2 Availability of 24 hours of doctor care for patients on hospital ward.
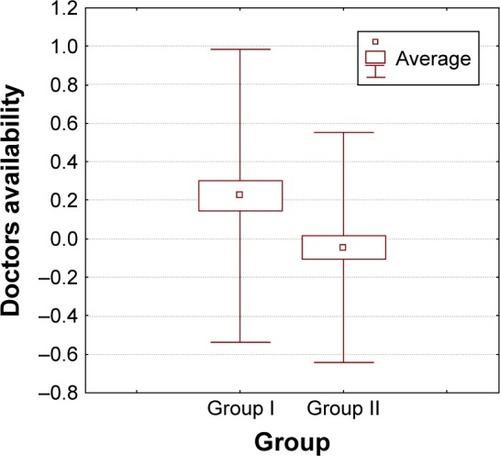
Table 3 Do medical employees explain to patients about the drug therapy and its side effects?
Table 4 Are the doctors available for patients on the ward for 24 hours?
Table 5 Patients’ satisfaction with quality of care and their assessment
Figure 3 Patients’ assessment of doctor engagement in the treatment process.
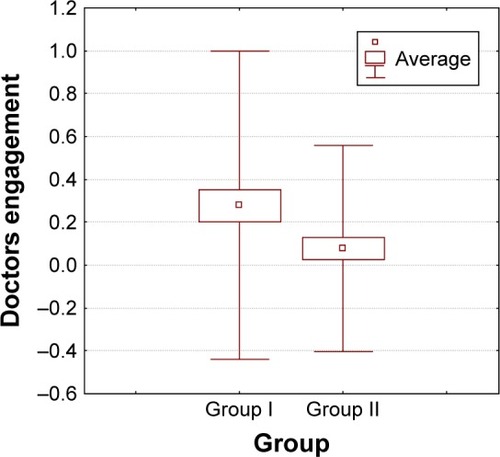
Figure 4 Patients’ willingness to recommend hospital services.
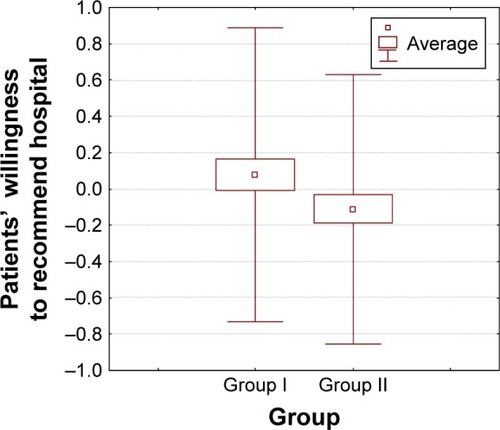
Table 6 Analysis of the number of employed medical employees in groups of hospital
Table 7 Engagement of medical employees in the treatment process on hospitals wards