Figures & data
Table 1 Respondent demographics, practice information, and prescribing information
Figure 1 (A) Percentage of patients receiving pharmacotherapy for acromegaly; (B) percentage of patients receiving combination therapies.
Note: *Other refers to any agent(s) other than a somatostatin analog (eg, pegvisomant and cabergoline).

Figure 2 Frequency of speaking with nurses and discussion of support structure.
Notes: No difference between physicians who do and do not believe that patient adherence significantly impacts treatment outcome in terms of the proportion of patients who speak with a nurse the same day they are diagnosed (t[124] =1.208, P=0.229) and no difference in terms of the proportion of patients with whom they discussed support structure (t[124] =0.556, P=0.480).
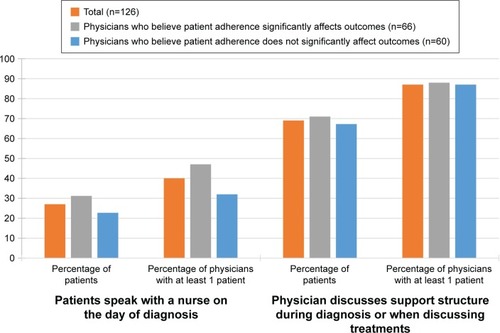
Table 2 Discussion of adherence support tools and programs
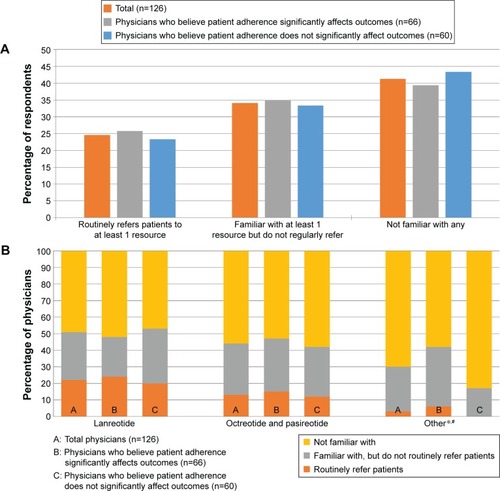
Figure 3 (A) Overall referrals for patient education resources; (B) awareness of and referrals to patient education resources.
Notes: No significant difference between respondents who do and do not believe patient adherence significantly impacts treatment outcome in the proportion who routinely refers patients to at least one program, the proportion familiar with at least one program, and the proportion being familiar with any program, X2 (2, N=126) =0.654, P=0.721. *Significant overall difference (chi-square P=0.015) between B and C; significant pairwise differences (P<0.05) for “familiar with, but do not routinely refer” and for “not familiar with.” #Significant overall difference (chi-square P=0.012) between B and C; significant pairwise differences (P<0.05) for “familiar with, but do not routinely refer” and for “not familiar with.” ‡Others: additional support groups and educational resources may be found through the endocrine societies of individual countries/regions. Acromegaly Info (www.acromegalyinfo.com); Hormone Health Network (www.hormone.org); Pituitary Disorders (www.pituitarydisorder.net); Pituitary Foundation (www.pituitary.org.uk); Pituitary Society (www.pituitarysociety.org); You and Your Hormones (http://www.yourhormones.info); Pituitary Network Association (www.pituitary.org); Acromegaly Community (www.acromegalycommunity.com).
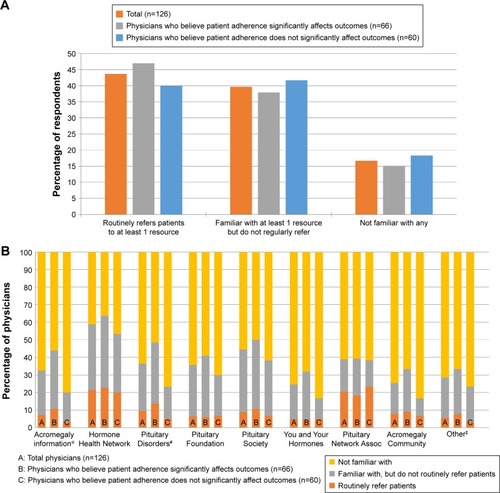
Figure 4 (A) Overall referrals for patient financial resources; (B) awareness of and referrals to patient financial resources.
Notes: No significant difference between respondents who do and do not believe patient adherence significantly impacts treatment outcome in the proportion who routinely refer patients to at least one program, the proportion familiar with at least one program (though not routinely referring patients to any), and the proportion being familiar with any program, X2 (2, N=126) =0.214, P=0.898. *Others: additional financial information found through the endocrine societies of individual countries/regions. #Significant overall difference (chi-square P=0.004) between B and C; significant pairwise differences (P<0.05) for “familiar with, but do not routinely refer” and for “not familiar with.” Financial assistance for lanreotide (http://acromegaly.somatulinedepot.com/resources/copay-savings-programs); Financial assistance for octreotide and pasireotide (1-877-LAR-IN FO, peak Pituitary Education, Access, and Knowledge, www.endocrineaccessnow.com).