Figures & data
Figure 1 The PatientPartner process.
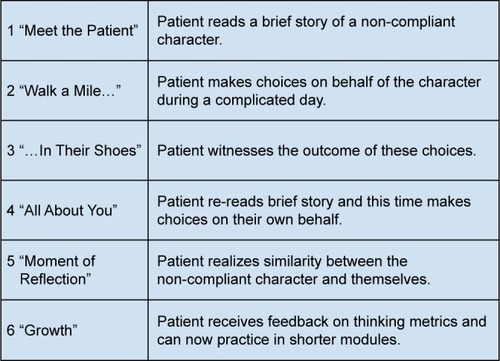
Figure 2 Mean changes in intervention group on medication, diet, and exercise at 3 weeks.
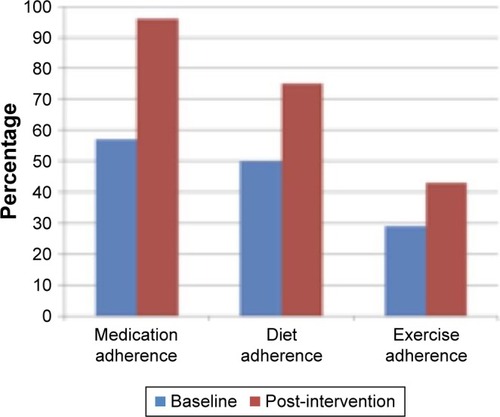
Table 1 Mean changes in intervention and control group on medication, diet, and exercise at 3 weeks
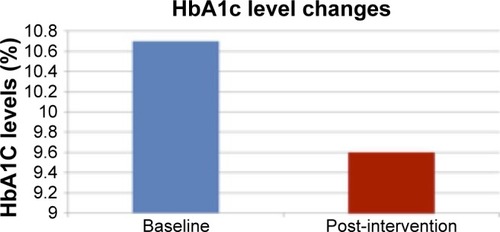
Figure 3 Mean change in HbA1c levels in intervention group between baseline and 3 months.
Abbreviation: HbA1c, glycosylated hemoglobin.