
Figures & data
Table 1 Demographic and clinical characteristics by depressive symptom category (n=4,018)
Table 2 Association between depressive symptom severity and cardiometabolic medication adherence for 4,018 adults with type 2 diabetes
Figure S1 Flowchart of new cardiometabolic medication user cohort.
Abbreviations: DISTANCE, the Diabetes Study of Northern California; PHQ, Patient Health Questionnaire.
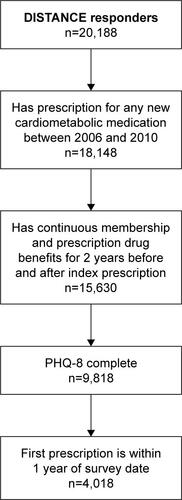
Figure S2 DAG demonstrating covariate selection.
Notes: Shaded box: variable included in multivariate analyses; white box: variable excluded as potential confounder and therefore not included in multivariate analyses; solid arrow: causal pathways that do not confound the association between depressive symptoms and cardiometabolic medication adherence; dotted arrow: causal pathways that potentially confound the association between depressive symptoms and cardiometabolic medication adherence in unadjusted analyses but are no longer confounders in multivariate models that include the variables identified in the shaded boxes. The DAG was constructed to illustrate the hypothesized causal relationships and time ordering between variables associated with depressive symptoms and cardiometabolic medication adherence. All of the variables represented were available in the DISTANCE data set. Analysis of the DAG followed an established process to identify which of these variables were potential confounders of the association between depressive symptoms and adherence.Citation1 This analysis revealed that adjustments for the variables in the shaded boxes (age, gender, race/ethnicity, marital status, and diabetes complications) were necessary and sufficient to address potential confounding variables, whereas variables in the white boxes were excluded as covariates because they did not function as potential confounders. Causal pathways illustrated by the gray dotted arrows are accounted for by adjustment of the identified covariates, and therefore, these relationships do not confound the association between depressive symptoms and adherence. This includes all variables with casual links to the independent variable, depressive symptoms. The remaining causal relationships (solid arrows) do not function as confounders and therefore do not require adjustment. This is visualized in the graph because variables that are causally associated with the dependent variable (variables in white boxes that have solid arrows to adherence) are not causally associated with the independent variable (these variables do not have solid arrows terminating at depressive symptoms).
Abbreviations: DAG, directed acyclic graph; DISTANCE, the Diabetes Study of Northern California; PHQ, Patient Health Questionnaire.
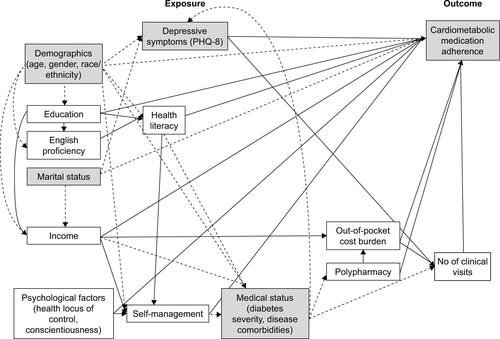
Table S1 Classification of cardiometabolic medications