Figures & data
Table 1 Demographic and relative clinical information of 76 OSAS patients at baseline
Figure 1 The crude relationship between adherence and ESS and FSS scores in each 3-week period.
Abbreviations: h, hour; wk, weeks.
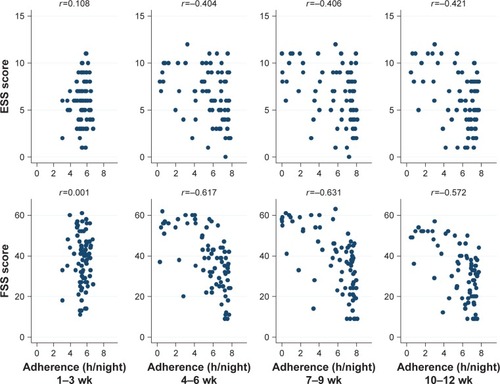
Figure 2 The crude relationship between adherence and SDS and PSQI scores in each 3-week period.
Abbreviations: h, hour; wk, weeks.
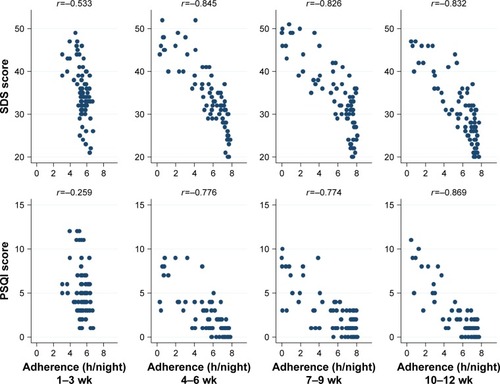
Table 2 Distributions of adherence levels at each therapy phase (N=76 in each therapy phase)
Table 3 Distributions of ESS, FSS, SDS and PSQI scores across adherence levels through 12-week nCPAP therapy
Table 4 Mixed-effects models of influencing factors of ESS, FSS, SDS and PSQI scores during 3-month nCPAP therapy
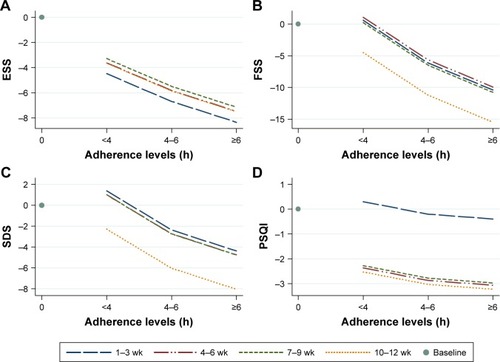
Figure 3 Adjusted relationships between adherence range and the changes in ESS, FSS, SDS and PQSI scores from baseline within each 3-week period during first 3 months of nCPAP therapy.
Abbreviations: nCPAP, nasal continuous positive airway pressure; h, hours; wk, weeks.