
Figures & data
Table 1 Randomization groups as a two-factorial design
Figure 1 Consort flowchart.
Abbreviations: D, day; DN, day and night; D + SPC, day with supportive phone calls; DN+ SPC, day and night with supportive phone calls.
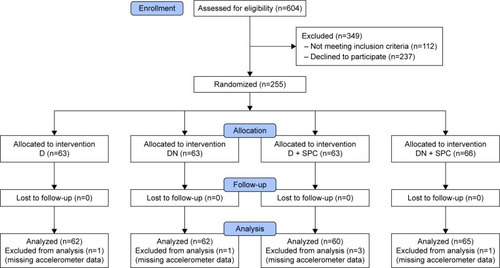
Table 2 Baseline characteristics by group
Table 3 Descriptive statistics of wearing time between 8 am and 10 pm (in hours) by group; N=249
Table 4 Results of the primary regression model by a negative binomial regression approach
Table 5 Results of the subgroup analysis for participants with completed diary data of the four groups, regarding the relative adherence by a negative binomial regression approach
Table 6 Subgroup analysis considering the number of supportive phone calls, adjusted for age and sex