Figures & data
Figure 1 Flowchart showing patient disposition.
Abbreviations: DOAC, direct oral anticoagulant; P-DOAC, primary DOAC; P-VKA, primary VKA; S-DOAC, switch from VKA to DOAC; S-VKA. switch from DOAC to VKA; VKA, vitamin K antagonists.
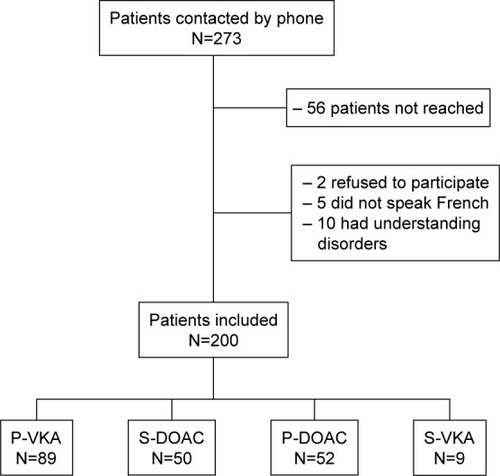
Table 1 Patient characteristics
Table 2 EQ-5D-3L VAS scores by group
Figure 2 Distribution of patients with any problem (moderate or extreme) over time, for each of the EQ-5D dimensions.
Abbreviations: DOAC, direct oral anticoagulant; EQ-5D, EuroQol 5-Dimensions; P-DOAC, primary DOAC; P-VKA, primary VKA; S-DOAC, switch from VKA to DOAC; VKA, vitamin K antagonists.

Figure 3 Convenience and satisfaction dimension scores.
Abbreviations: DOAC, direct oral anticoagulant; P-DOAC, primary DOAC; P-VKA, primary VKA; S-DOAC, switch from VKA to DOAC; VKA, vitamin K antagonists.
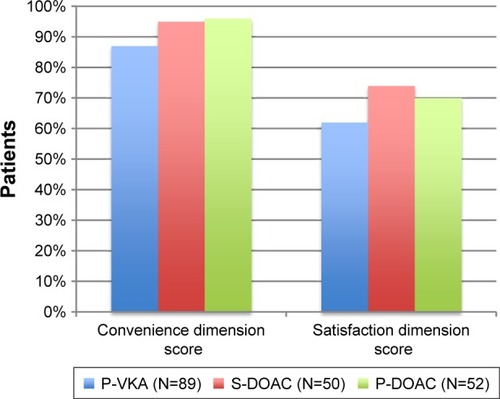
Table 3 PACT-Q2 scores by group
Figure 4 MMAS-8 French translation scores: distribution of patients according to adherence.
Note: The MMAS (8-item) content, names, and trademarks are protected by US copyright and trademark laws. Permission for use of the scale and its coding is required. A license agreement is available from Donald E. Morisky, ScD, ScM, MSPH, 14725 NE 20th St Bellevue, WA 98007, USA; [email protected].
Abbreviations: DOAC, direct oral anticoagulant; MMAS-8, Morisky Medication Adherence Scale; P-DOAC, primary DOAC; P-VKA, primary VKA; S-DOAC, switch from VKA to DOAC; VKA, vitamin K antagonists.
Abbreviations: DOAC, direct oral anticoagulant; MMAS-8, Morisky Medication Adherence Scale; P-DOAC, primary DOAC; P-VKA, primary VKA; S-DOAC, switch from VKA to DOAC; VKA, vitamin K antagonists.
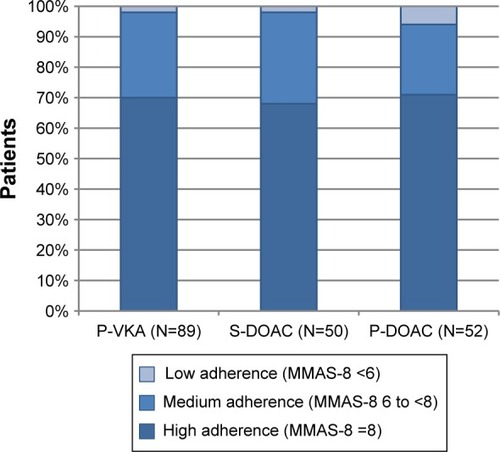
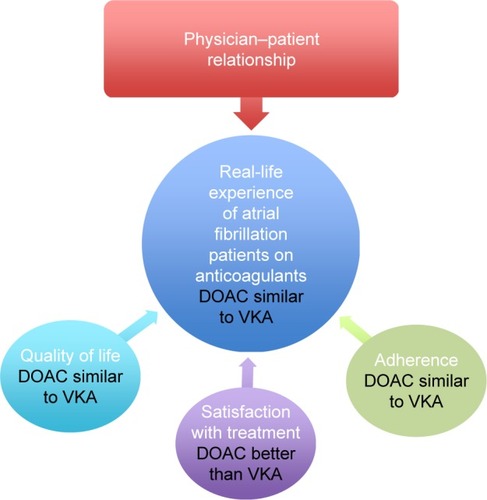
Figure 5 Real life experience of patients with atrial fibrillation on oral anticoagulants: quality of life, satisfaction, and adherence.
Abbreviations: DOAC, direct oral anticoagulant; VKA, vitamin K antagonists.