
Figures & data
Figure 1 Examples of time-series adherence charts to highlight the importance of considering both the magnitude and the variability of adherence.
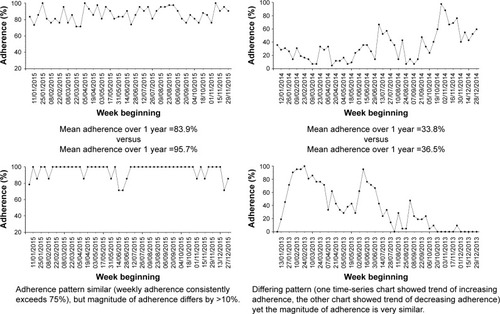
Figure 2 An example of the impact of using different data duration to infer the annual adherence level.
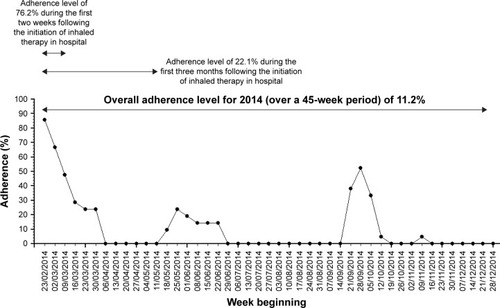
Figure 3 Examples of adherence patterns that are relatively easy and those that are more difficult to identify with visual inspection.
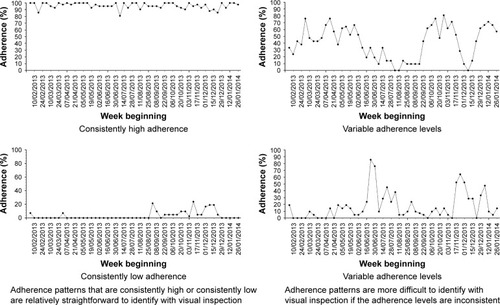
Figure 4 Summary of the steps involved in clustering adherence data using our proposed algorithm-based technique.
Notes: It is important to display both the detailed scores for each section and the overall cluster for the data, so that the overall cluster can be interpreted accurately. In this example, the overall adherence is low, but the adherence is improving with time over a 9-month period from January to September 2015.
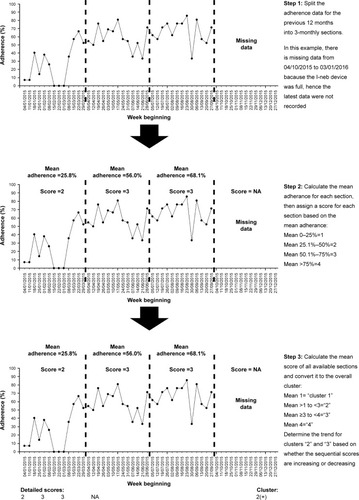
Figure 5 Weekly normative adherence time-series charts for the three example cases.
Note: 3(o), no clear adherence trend.
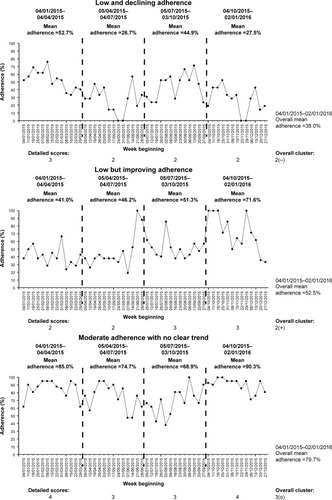
Table 1 Summary of the adherence clusters for the three example cases