
Figures & data
Figure 1 The frequency of office visits in clinical trials greatly differs compared to those seen in practice.
Notes: Clinical trials typically include assessment visits often during a study. Having a visit at baseline (week 0) and weeks 1, 2, 4, 6, 8, and 12 is common. This allows the clinical researcher to report the course and effectiveness of the intervention. In the “real world”, visits typically occur every 12 weeks. The increase in office visits seen in clinical trials might indirectly increase patient adherence to the intervention. This practice lies in parallel to the flossing before the dentist and weekly piano lesson behaviors.
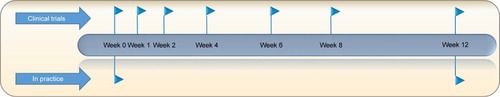
Figure 2 The effect of accountability in medication adherence.
Notes: The group randomized to the Internet-based survey (accountability intervention) once a week had higher rates of adherence over the 12-week study period. Reproduced with permission from JAMA Dermatology. 2011;147(10):1223. Copyright © 2011 American Medical Association. All rights reserved. Yentzer BA, Wood AA, Sagransky MJ, et al. An Internet-based survey and improvement of acne treatment outcomes.Citation24
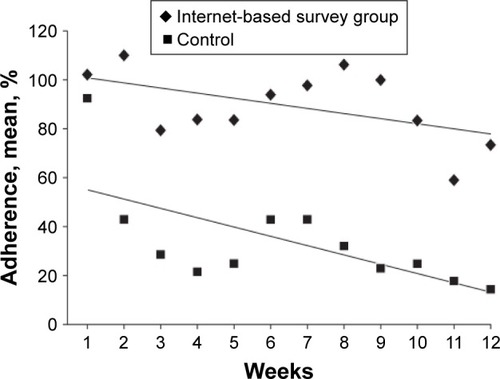
Figure 3 Autonomous accountability versus controlled accountability in clinical practice.
Notes: (A) A provider (top)/patient (bottom) interaction; one in which the health care provider makes demands and any accountability might drive fear or shame (controlled accountability). (B) A shared partnership model in which accountability to good adherence gives the patient the opportunity to please himself or herself and the provider (autonomous accountability). Adapted from Servier medical art [homepage on the Internet]. Powerpoint image bank. Servier; 2013 [modified August 8, 2013]. Available from: http://www.servier.com/Powerpoint-image-bank.Citation72
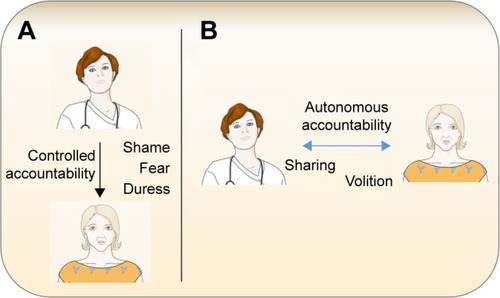
Figure 4 The inclusion of autonomous and controlled accountability in a modified version of Bandura’s Social Cognitive Theory.
Notes: Autonomous and controlled accountability are regulated by social interactions. The possibility of needing to account for one’s actions through a social interaction functions as a behavioral amplifier. Whether the intervention is considered a form of controlled or autonomous accountability is mediated by the individual’s personal factors (knowledge, expectation, attitudes). The dashed line in the figure justifies controlled accountability as possibly having minimal impact on long-term behavioral change. Once the individual internalizes his or her sense of accountability, self-efficacy may further aid in increasing adherence. With all these different factors assimilated, enabling factors (eg, cues to action) are included as features that could potentially augment accountability and further increase adherence rates.
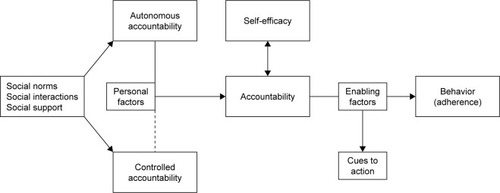
Table 1 Testable accountability hypotheses
Table S1 Dominant health behavior models and their constructs