
Figures & data
Figure 1 Example of a case vignette and survey treatment options.
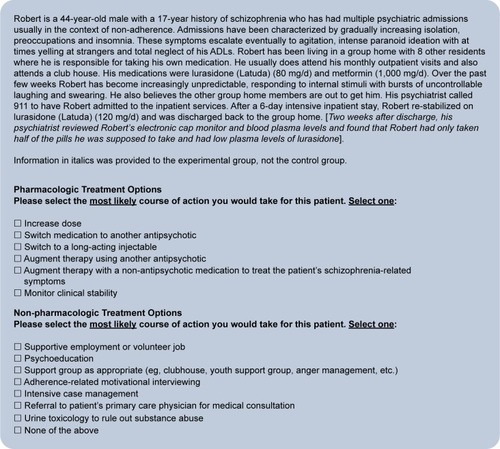
Figure 2 CONSORT diagram.
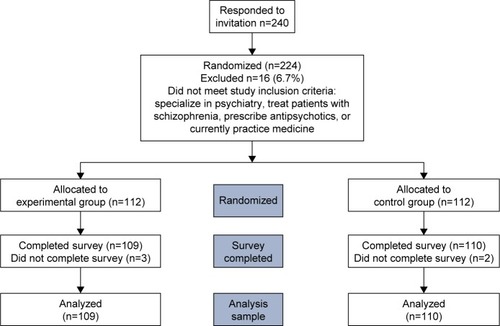
Table 1 Respondent demographic and practice characteristics
Figure 3 Effect of PDAI on treatment decisions for (A) nonadherent patients (results represent average from 3 vignettes), (B) adherent but poorly controlled patients (results represent average from 2 vignettes), and (C) adherent and well-controlled patients. The P-values were calculated based on a multinomial logistic regression performing pairwise comparison of each treatment decision pair across the 2 groups of respondents, adjusting for multiple comparisons using false discovery rate-adjustment.
Abbreviations: PDAI, patient drug adherence information; LAI, long-acting injectable.
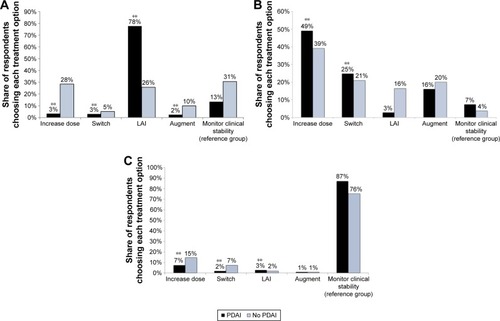
Table S1 Distribution of key patient characteristics in vignettes
Table S2 Descriptions of clinical vignettes