
Figures & data
Figure 1 Flow diagram of healthcare pathway.
Abbreviations: PAC, post-acute care; PAC-CVD, post-acute Care Cerebrovascular Diseases.
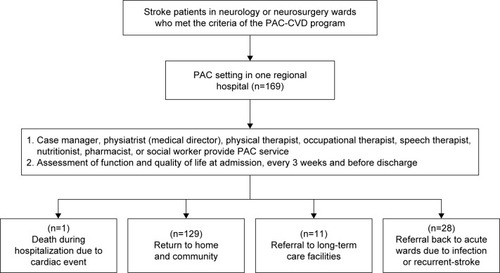
Table 1 Baseline data of stroke patients
Table 2 Effect of functional performance and quality of life in patients with stroke
Table 3 Ratio of Modified Rankin Scale (MRS) at admission
Table 4 Number and ratio of the change of EQ-5D after the program