Figures & data
Figure 1 Three different ways for calculating the MPR value.
Abbreviations: FMPR, Fixed MPR; MPR, Medication Possession Ratio; VMPR, Variable MPR; Rx, prescription fill.
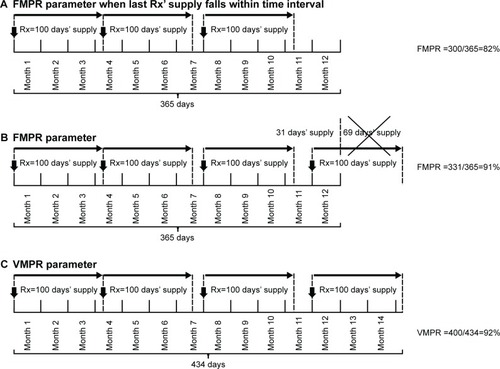
Figure 2 (A) Histogram of acquisition quantities (n=212,875). (B) Histogram of days between two subsequent acquisitions (n=193,328). (C) Cross-correlation correlogram of both histograms.
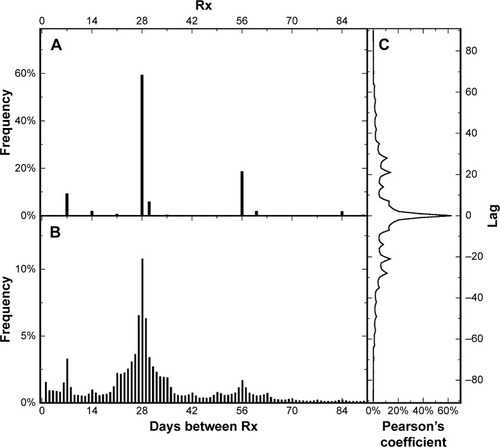
Figure 3 VMPRm and FMPR trends together with their sample sizes as well as the weighted average.
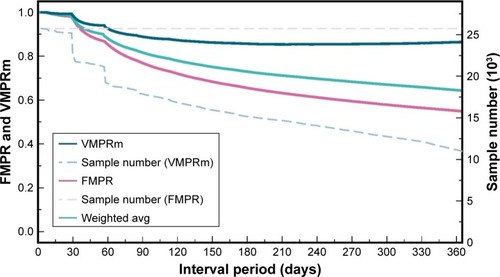
Figure 4 (A) FMPR trends for patients with different numbers of acquisitions. (B) VMPRm trends for patients with different numbers of acquisitions. Note that trends have been truncated when the sample number is below 3% of the initial sample number (25,724).
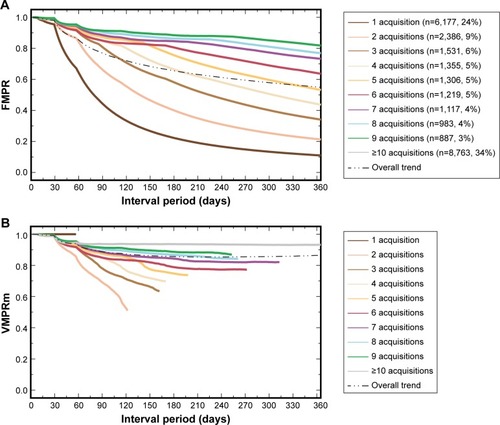
Figure 5 FMPR trends for different minimum numbers of acquisitions.
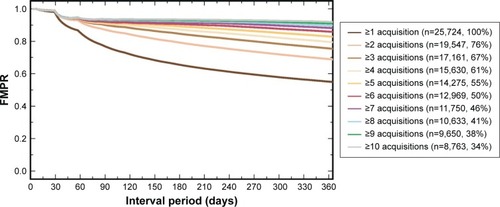
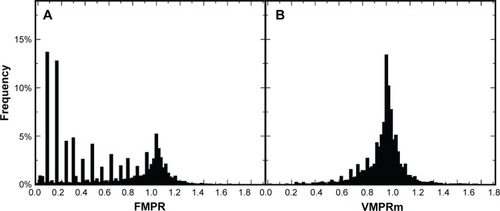
Figure 6 Histograms of individual (A) FMPR values and (B) VMPRm values for a time interval of 365 days after the patient’s index date and without capping at one.