
Figures & data
Figure 1 Flowchart of the survey.
Note: The diagram displays the progress through the steps of the market survey (instructions and evaluation of device in use, questions regarding ideal device, instructions and evaluation of the two non-used devices, and total evaluation of the devices).
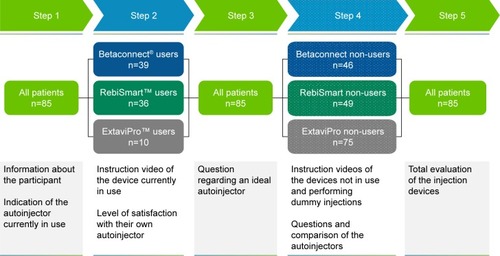
Table 1 Demographic characteristics
Figure 2 Satisfaction level with device currently in use.
Notes: Participants evaluated their device in use via scale points (1= not satisfied at all, 10= very satisfied). The percentage of participants rating with 8–10 points (top three rankings) is highlighted in red (mean values).
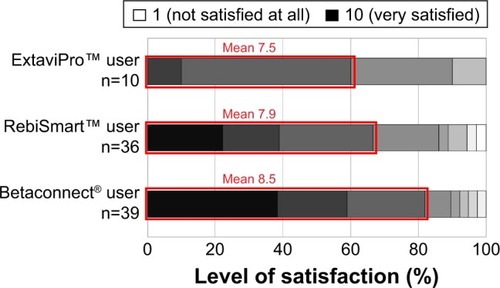
Table 2 Most desired improvements of own device proposed by the participants
Table 3 Comparison of ideal device features and availability of these features in the devices ranked by non-users
Figure 3 Feature evaluation of the autoinjectors not in use.
Notes: Agreement level of participants with statements regarding features of the devices not in use (non-users) were queried via scale points (1= not agree at all, 10= totally agree). Top three rankings (8–10 points on rating scale, mean values) are listed and significance is indicated (b,cP<0.05 comparing the respective device with device A, B, or C, respectively). For example, regarding “Easy handling of the injection device”, the Betaconnect (device A) was rated significantly better than the RebiSmart (device B) and the ExtaviPro (device C). The percentage of participants with top-three rankings (8–10 scale points) is illustrated.
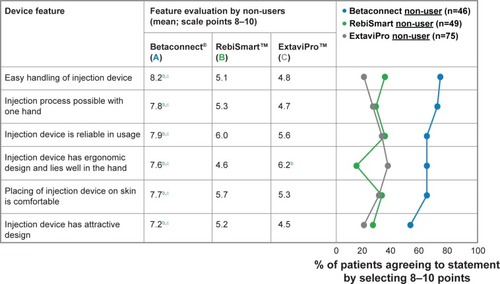
Figure 4 Final assessment of all three injection devices.
Notes: Participants indicated their autoinjector preference after presentation of all devices (dark; number of patients). Currently used injection devices are depicted for comparison (light; number of users).
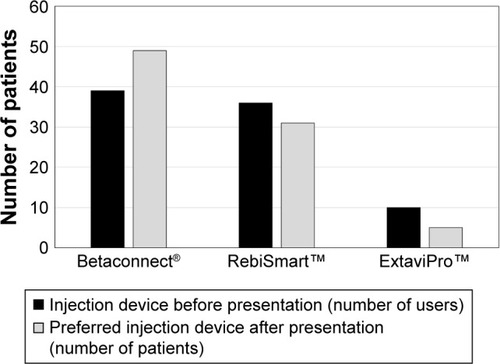
Table S1 Questionnaire used for the structured face-to-face interviews