
Figures & data
Table 1 An example of how out-of-pocket costs are computed from a $60 CAD prescription filled between January 1 and June 30, 2006
Figure 1 Study flow chart.
Abbreviations: AHA, antihypertensive agents; ESA, “Étude sur la santé des aînés”; MED-ECHO, “Maintenance et exploitation des données pour l’étude de la clientèle hôspitalière” [Database on hospitalizations]; MMSE, mini-mental state examination; RAMQ, “Régie de l’Assurance Maladie du Québec” [Quebec’s medical insurance plan].
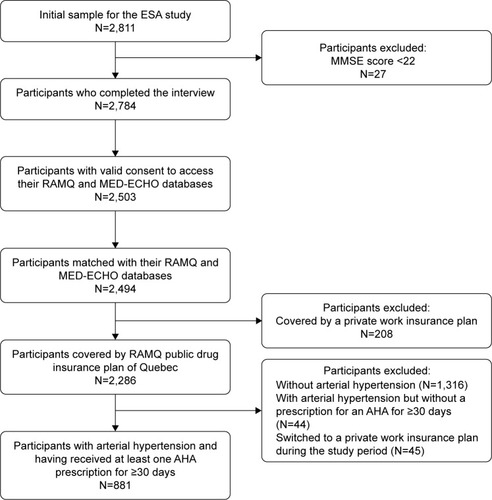
Figure 2 Time frame for data collection for each participant.
Note:
aThe baseline interviews (T1) were conducted between February 27, 2005 and November 22, 2007. T2 represented as second interviews.
Abbreviations: ICD-9/10, International Classification of Diseases, 9th or 10th Edition; PDC, proportion of days covered.
Abbreviations: ICD-9/10, International Classification of Diseases, 9th or 10th Edition; PDC, proportion of days covered.
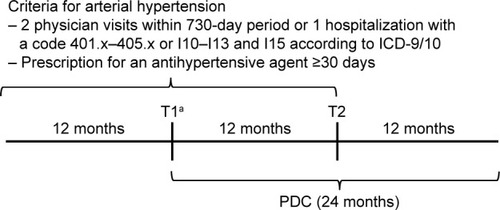
Table 2 Classes of antihypertensive agents and comorbidities identified in the participants
Table 3 Participants’ characteristics by adherence to antihypertensive agents (N=881)
Table 4 Overall bivariate and multivariable logistic regressions for medication adherence during the 2-year follow-up period (N=881)
Table 5 Multivariable logistic regressions by annual household income, for medication adherence during the 2-year follow-up period