Figures & data
Table 1 Attributes and levels in the discrete choice experiment
Figure 1 Example of patient discrete choice experiment task.
Abbreviation: IV, intravenous.
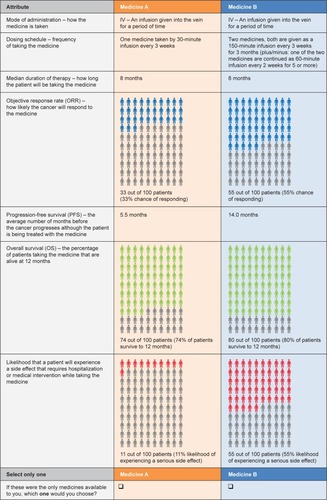
Figure 2 Example of oncologist discrete choice experiment task.
Abbreviations: BRAF, B-Raf; ECOG PS, Eastern Cooperative Oncology Group Performance Status; IV, intravenous; LDH, lactic acid dehydrogenase.
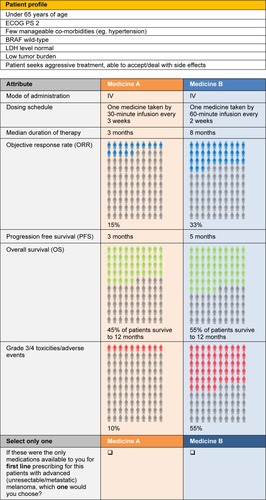
Figure 3 Relative preference weights for patients and oncologists, as estimated by Hierarchical Bayesian logistic regression models with effects coding.
Abbreviations: AEs, adverse events; DS, dosing schedule; IV, intravenous; MDT, median duration of therapy; MoA, mode of administration; med, medication; OS, overall survival; ORR, objective response rate; PFS, progression-free survival.
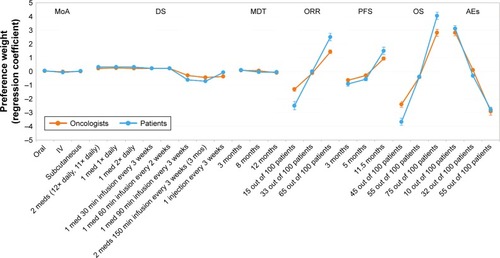
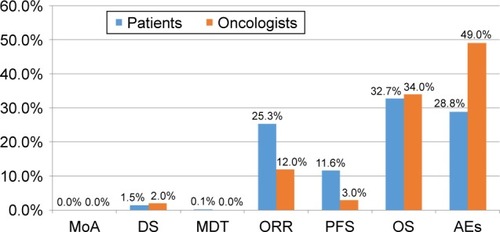
Figure 4 Relative importance of attributes for patients and oncologists.
Abbreviations: AEs, adverse events; DS, dosing schedule; MDT, median duration of therapy; MoA, mode of administration; ORR, objective response rate; OS, overall survival; PFS, progression-free survival.