
Figures & data
Figure 1 Participant flow chart.
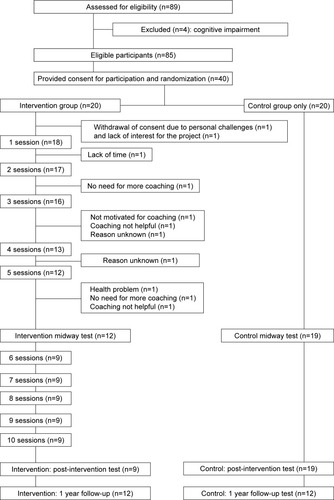
Table 1 Baseline demographics and clinical characteristics
Table 2 Means and standard deviations of health-related quality of life scores from the CFQ-R at baseline, midway, post-intervention, and follow-up
Table 3 Means and standard deviations of secondary outcomes at baseline, midway, post-intervention, and follow-up
Table 4 Baseline and post-intervention distribution of adherence and depression scores
Table 5 The main effects between the intervention group and the control group over time (baseline, midway, post-intervention, and follow-up) on secondary outcomes