Figures & data
Table 1 The general information of patients and main caregivers
Table 2 Results of care burden, rehospitalization rate, and medication compliance at different time points
Table 3 The influence of different patterns of EE on care burden and rehospitalization rate
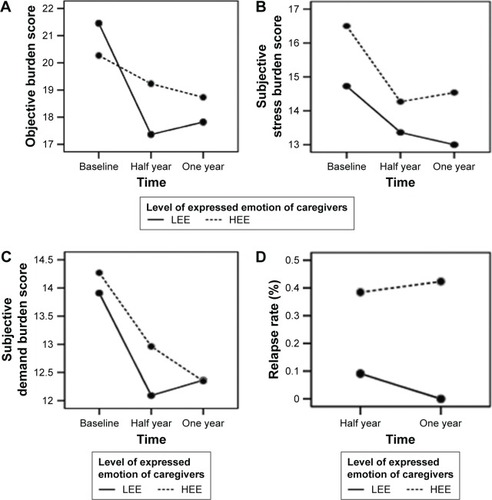
Figure 1 The correlation analysis.
Notes: (A) The association between objective burden and time. (B) The association between subjective stress burden and time. (C) The association between subjective demand burden and time. (D) The association between rehospitalization rate and time.
Abbreviations: LEE, low expressed emotion; HEE, high expressed emotion.
Abbreviations: LEE, low expressed emotion; HEE, high expressed emotion.