
Figures & data
Figure 1 Patient enrollment, follow-up, and analysis.
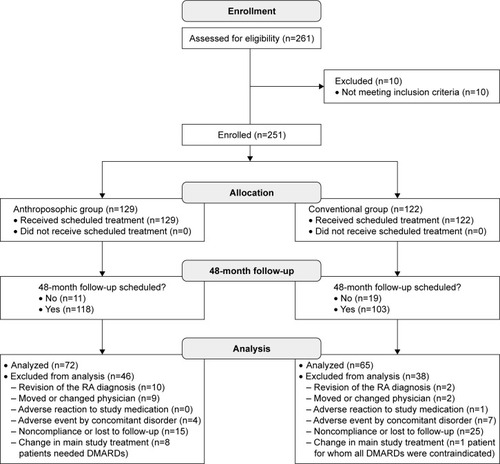
Table 1 Demographics and baseline characteristics
Table 2 Secondary categorical outcomes at months 0 and 48
Table 3 Use of corticosteroids and NSAIDs in years 1–4
Table 4 Primary clinical outcome analyses
Figure 2 RA-VAS total score.
Abbreviation: RA-VAS, Rheumatoid Arthritis Visual Analog Scale.
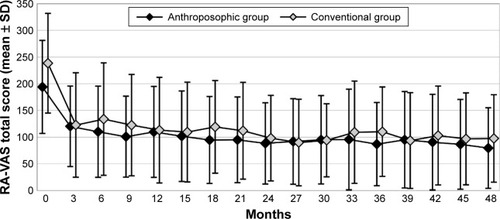
Figure 3 C-reactive protein.
Abbreviation: CRP, C-reactive protein.
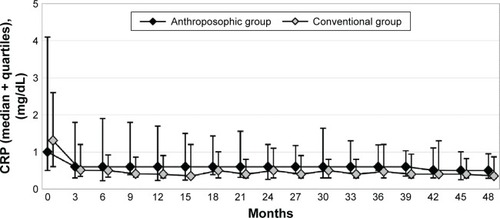
Figure 4 Ratingen Score.
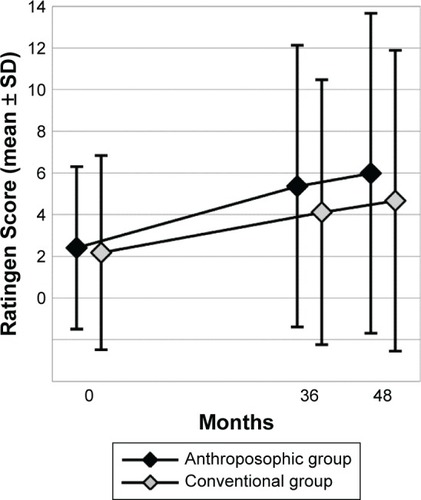
Table 5 Safety outcomes in months 0 and 48
Figure S1 Patient ratings of therapy tolerability (“poor”–“average”–“good”).
Note: Percentage of patients with the rating “good tolerability” are as follows: in months 0 (Anthroposophic group: n=99, Conventional group: n=86), 3 (122+107), 6 (115+105), 9 (114+95), 12 (109+95), 15 (107+92), 18 (105+87), 21 (98+88), 24 (95+86), 27 (87+61), 30 (84+61), 33 (84+60), 36 (82+56), 39 (70+53), 42 (73+56), 45 (69+53), and 48 (68+57).

Figure S2 Physician ratings of therapy tolerability.
Note: Physician ratings of therapy tolerability on a VAS (0= no adverse reactions, 100= most severe adverse reactions) in months 0 (Anthroposophic group: n=99, Conventional group: n=86), 3 (126+111), 6 (122+110), 9 (118+107), 12 (117+102), 15 (115+99), 18 (112+94), 21 (103+94), 24 (100+92), 27 (92+69), 30 (89+68), 33 (85+68), 36 (83+65), 39 (75+60), 42 (72+61), 45 (71+59), and 48 (71+64).
Abbreviation: VAS, visual analog scale.
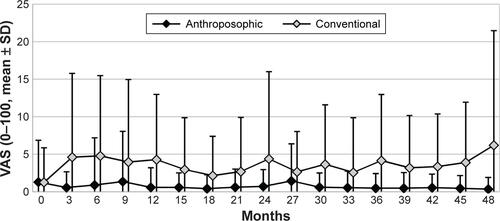
Figure S3 Use of corticosteroids in months 0–48.
Note: Use is calculated as average dose in prednisolone equivalents among steroid users in each 3-month period (“3” indicating “months 1–3” and so on).
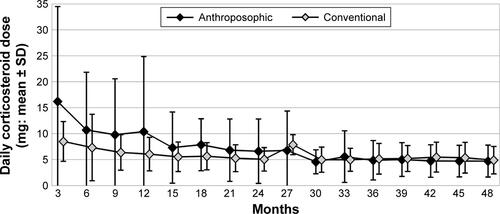
Figure S4 Use of NSAIDs in months 0–48.
Note: Use is calculated as average dose in diclofenac equivalents among NSAID users in each 3-month period (“3” indicating “months 1–3” and so on).
Abbreviation: NSAID, nonsteroidal anti-inflammatory drug.
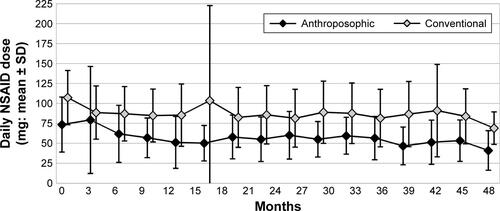
Figure S5 Disease Activity Score (0–10).
Note: Disease Activity Score (0–10) in months 0 (Anthroposophic group: n=129, Conventional group: n=108), 3 (176+104), 6 (123+103), 9 (118+99), 12 (118+99), 15 (115+94), 18 (111+90), 21 (105+90), 24 (101+89), 27 (93+66), 30 (89+64), 33 (85+64), 36 (86+63), 39 (74+56), 42 (73+59), 45 (72+55), and 48 (71+63).
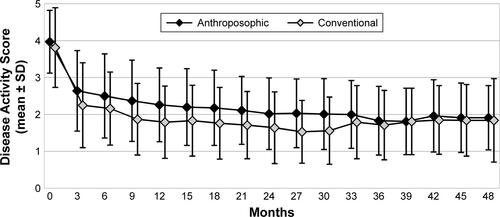
Table S1 Patient numbers at each follow-up
Table S2 Dropout analyses
Table S3 RA-VAS and C-reactive protein, alternative analyses