
Figures & data
Figure 1 Outline of study design.
Abbreviations: HAMA, Hamilton Anxiety Scale; HAMD, Hamilton Depression Scale; EORTC QLQ-C30, Europe Organization for Research and Treatment of Cancer Quality of Life Questionnaire.
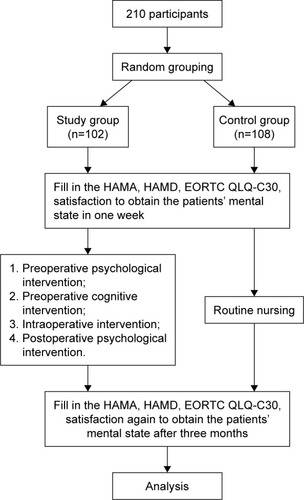
Table 1 Comparison of HAMD and HAMA scores between the 2 groups
Table 2 Comparison of QOL score and each dimension between the 2 groups
Table 3 Comparison of hospitalization duration, hospitalization expenses, patient satisfaction, and compliance rate between the 2 groups