Figures & data
Figure 1 Overall study design diagram.
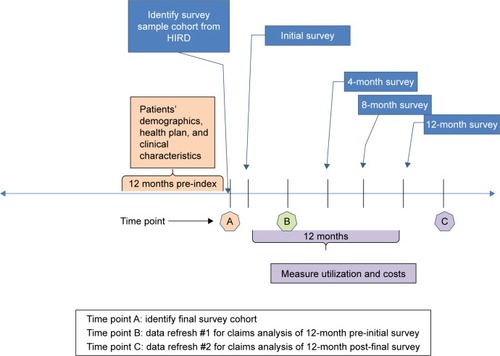
Table 1 Demographic characteristics overall and by OAC cohort at initial survey
Table 2 Clinical characteristics overall and by OAC cohort at initial survey
Table 3 Claims-determined comorbidities, stroke, and bleeding risk scores overall and by OAC cohort for the 12-month period before the initial survey
Table 4 Number of surveys completed per respondent and mean MMAS-8 and DASS scores by survey and OAC cohort for the 12-month period including and following the initial survey
Table 5 Comparison of adherence measured using PDC and the mean MMAS scores among NVAF patients with OAC therapy for the 12-month period including and after the initial survey
Figure 2 All-cause health care resource utilizationa between adherent and nonadherent patients using PDC calculated from claims for the 12-month period including and after the initial survey.
Abbreviations: PDC, proportion of days covered; INP, inpatient; ER, emergency room.
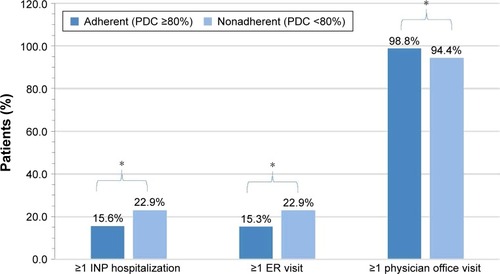
Figure 3 All-cause health care resource utilizationa between adherent and nonadherent patients using mean MMAS-8 scores determined from patient self-report for the 12-month period including and after the initial survey.
Abbreviations: MMAS-8, Morisky Medication Adherence Scale 8-item; INP, inpatient; ER, emergency room.
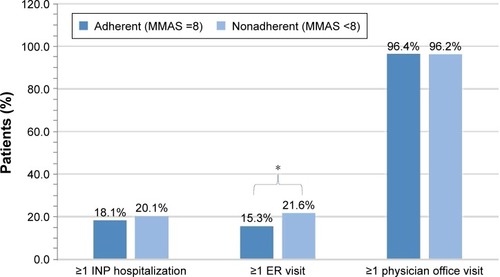
Figure 4 Comparison of all-cause, stroke-related, and bleeding-related total medical costsa between adherent and nonadherent patients using PDC calculated from claims for the 12-month period including and after the initial survey.
Abbreviation: PDC, proportion of days covered.
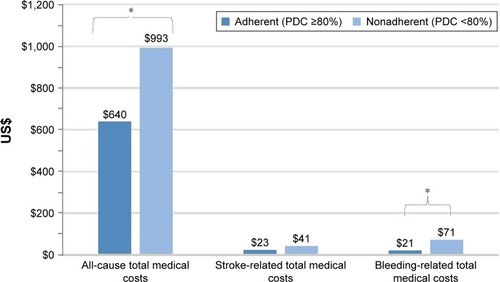
Figure 5 Comparison of all-cause, stroke-related, and bleeding-related total medical costsa between adherent and nonadherent patients using mean MMAS-8 scores determined from patient self-report for the 12-month period including and following the initial survey.
Abbreviation: MMAS-8, Morisky Medication Adherence Scale 8-item.
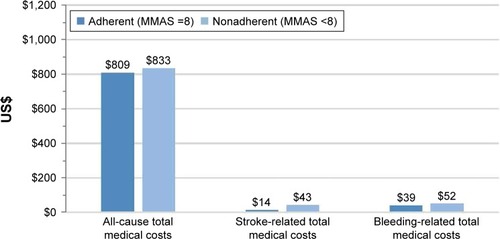
Figure 6 Comparison of all-cause total medical costs by type of services between adherent and nonadherent patients using PDC and mean overall MMAS-8 scores for the 12-month period including and following the initial survey.
Abbreviations: PDC, proportion of days covered; MMAS-8, Morisky Medication Adherence Scale 8-item.
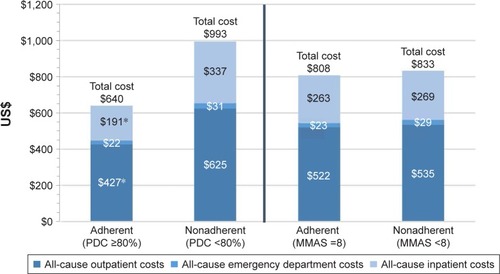
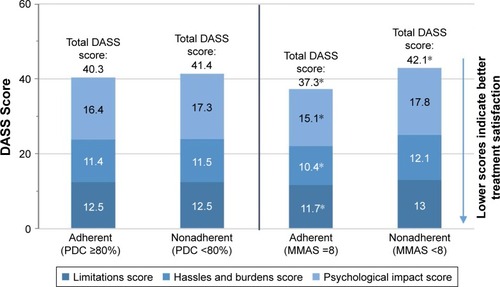
Figure 7 Comparison of Duke Anticoagulation Satisfaction Scale (DASS) mean scores between adherent and nonadherent patients using PDC and mean overall MMAS-8 scores for the 12-month period including and following the initial survey.
Abbreviations: PDC, proportion of days covered; MMAS-8, Morisky Medication Adherence Scale 8-item.