
Figures & data
Table 1 Baseline demographics and clinical characteristics of the matched populationTable Footnotea
Figure 1 Adherence to CZP therapy using the PDC and MPR measures with and without nurse assistance.
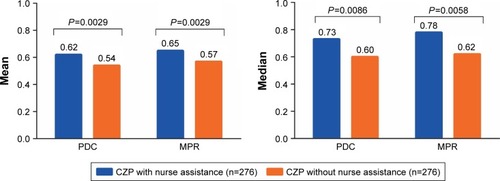
Table 2 Adherence and persistence with certolizumab pegol therapy with and without nurse assistance
Figure 2 Kaplan–Meier curves comparing time to discontinuation of treatment.
Abbreviation: CZP, certolizumab pegol.
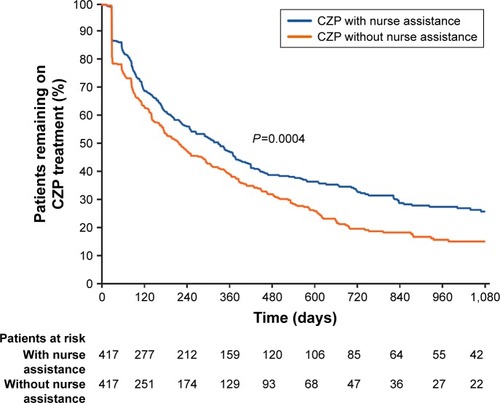
Table 3 The effect of nurse assistance on hospitalizations and total health care costs
Table 4 Multivariate regression analysis evaluating the impact of certolizumab pegol in combination with other covariates on hospitalization costs
Table 5 Multivariate regression analysis evaluating the impact of certolizumab pegol in combination with other covariates on total health care costs