Figures & data
Table 1 Survey questionnaire
Table 2 Patient demographic and clinical characteristics
Figure 1 Current method of injection administration.
Abbreviations: IFN, interferon; im, intramuscular; sc, subcutaneous.
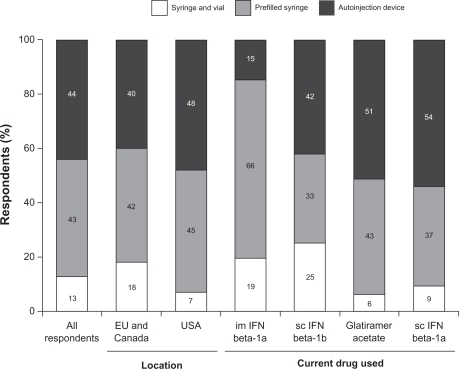
Figure 2 Reasons given for not self-injecting. Respondents could give more than one reason (values total more than 100%). Physical (total) score is the percentage of respondents selecting one or both of the two physical reasons; psychological (total) score is the percentage of patients selecting one or more of the psychological reasons.
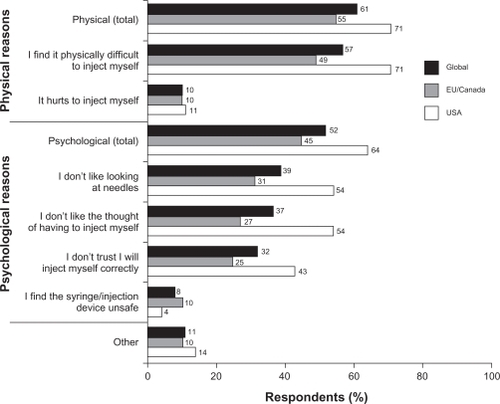
Table 3 Satisfaction with current injection method
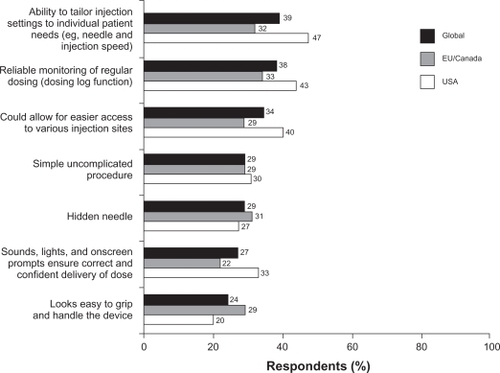
Figure 3 Benefits of the new autoinjection device most commonly cited by patients. Respondents could cite more than one benefit (values total more than 100%).