
Figures & data
Figure 1 Flow chart of participants throughout the study.
Abbreviation: PR, pulmonary rehabilitation.
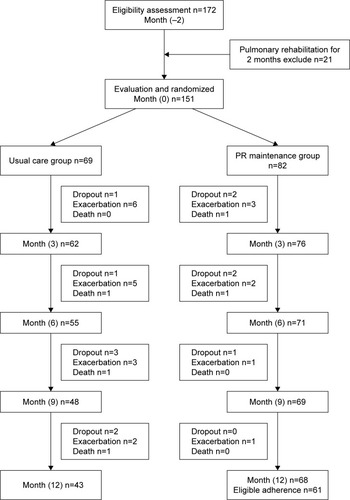
Table 1 Demographic characteristics of participants at baseline
Table 2 Clinical characteristics of participants in two groups before and after PR (baseline)
Figure 2 The patterns of 6MWT, mMRC, and COPD assessment during 1-year follow-up between groups.
Notes: (A) The patterns of 6MWT during 1-year follow-up between groups. (B) The patterns of COPD assessment during 1-year follow-up between groups. (C) The patterns of mMRC assessment during 1-year follow-up between groups. Data shown are mean values with error bars representing SE. Hollow circles express control groups, while solid circles express pulmonary rehabilitation maintenance group. 0 month expresses the time point when patients finished the pulmonary rehabilitation program. *Significant differences between groups at different time points (p<0.05).
Abbreviations: 6MWT, 6-minute walking test; mMRC, modified Medical Research Council scale; SE, standard error; CAT, COPD assessment test; PR, pulmonary rehabilitation.
Abbreviations: 6MWT, 6-minute walking test; mMRC, modified Medical Research Council scale; SE, standard error; CAT, COPD assessment test; PR, pulmonary rehabilitation.
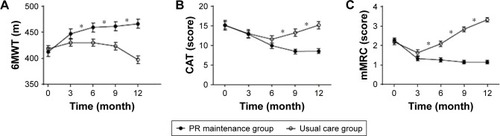
Table 3 Analysis of changes in emotional function over 1-year follow-up