Figures & data
Figure 1 Subject selection and attrition.
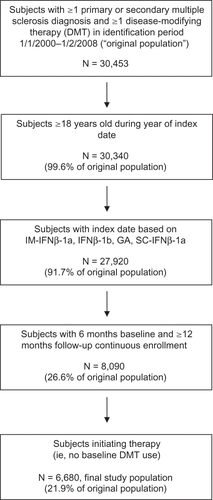
Table 1 Demographic and baseline clinical characteristics by index disease-modifying therapy
Table 2 Unadjusted disease-modifying therapy measures
Figure 2 Regression-adjusted odds ratios of adherence compared with IM-IFNβ-1a: all patients.
Abbreviation: IM-IFNβ-1a, intramuscular interferon beta-1a; IFNβ-1a, interferon beta-1b; GA, glatimer acetate; SC-IFNβ-1a, subcutaneous interferon beta-1a.
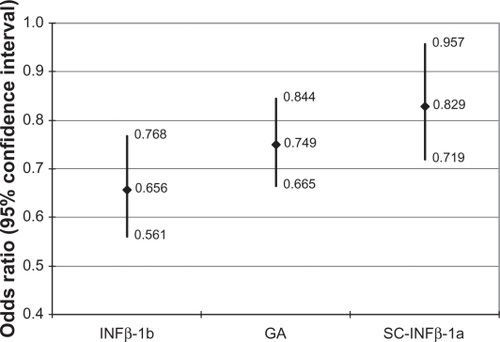
Table 3 Results of logistic regression modeling adherence: all patients
Figure 3 Kaplan–Meier failure curve of non-persistence.
Abbreviations: IM-IFNβ-1a, intramuscular interferon beta-1a; SC-IFNβ-1a, subcutaneous interferon beta-1a.
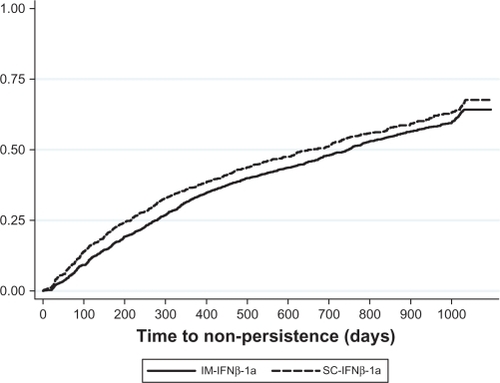
Table 4 Results of Cox proportional hazards regression modeling persistence: all patients