Figures & data
Table 1 Differences between demographic and clinical characteristics of adherent and nonadherent groups
Figure 1 Demographic and clinical feature selection using the LASSO binary logistic regression model.
Notes: (A) Optimal parameter (lambda) selection in the LASSO model used fivefold cross-validation via minimum criteria.Citation17,Citation24 The partial likelihood deviance (binomial deviance) curve was plotted versus log(lambda). Dotted vertical lines were drawn at the optimal values by using the minimum criteria and the 1 SE of the minimum criteria (the 1-SE criteria). (B) LASSO coefficient profiles of the 22 features. A coefficient profile plot was produced against the log(lambda) sequence. Vertical line was drawn at the value selected using fivefold cross-validation, where optimal lambda resulted in five features with nonzero coefficients.
Abbreviations: LASSO, least absolute shrinkage and selection operator; SE, standard error.
Abbreviations: LASSO, least absolute shrinkage and selection operator; SE, standard error.
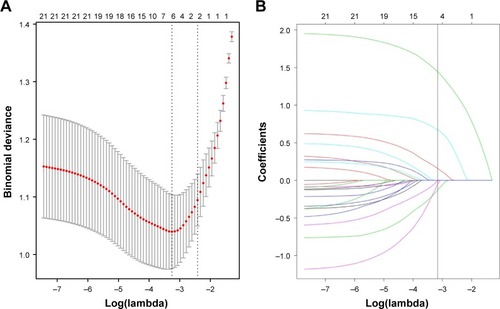
Table 2 Prediction factors for medication nonadherence in IRDs
Figure 2 Developed medication nonadherence nomogram.
Note: The medication nonadherence nomogram was developed in the cohort, with the use of GC, the use of NSAIDs, the number of medicine-related questions, education level, and the distance to hospital incorporated.
Abbreviations: GC, glucocorticoid; NSAIDs, nonsteroidal anti-inflammatory drugs.
Abbreviations: GC, glucocorticoid; NSAIDs, nonsteroidal anti-inflammatory drugs.
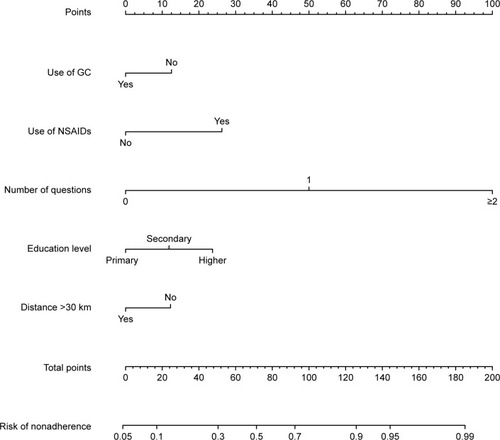
Figure 3 Calibration curves of the nonadherence nomogram prediction in the cohort.
Notes: The x-axis represents the predicted medication nonadherence risk. The y-axis represents the actual diagnosed nonadherence. The diagonal dotted line represents a perfect prediction by an ideal model. The solid line represents the performance of the nomogram, of which a closer fit to the diagonal dotted line represents a better prediction.
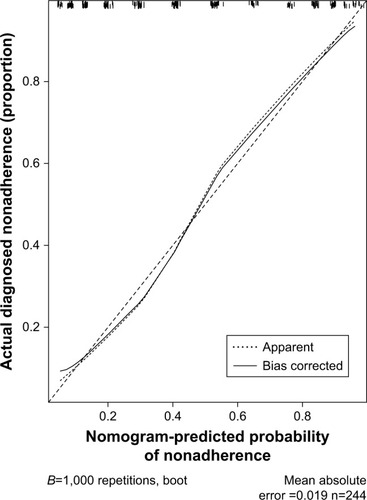
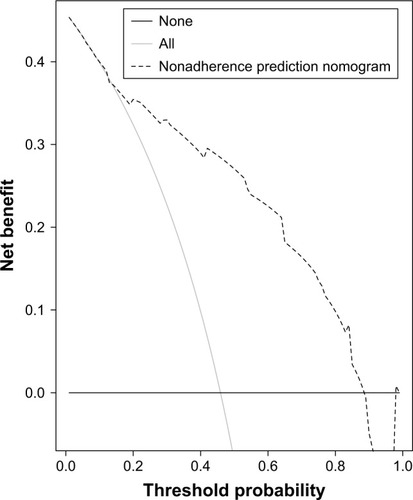
Figure 4 Decision curve analysis for the nonadherence nomogram.
Notes: The y-axis measures the net benefit. The dotted line represents the medication nonadherence risk nomogram. The thin solid line represents the assumption that all patients are nonadherent to medication. Thin thick solid line represents the assumption that no patients are nonadherent to medication. The decision curve showed that if the threshold probability of a patient and a doctor is >14 and <88%, respectively, using this nonadherence nomogram in the current study to predict medication nonadherence risk adds more benefit than the intervention-all-patients scheme or the intervention-none scheme.