
Figures & data
Figure 1 Flow diagram showing participants in the study.
Abbreviation: Con ttt, conventional treatment group.
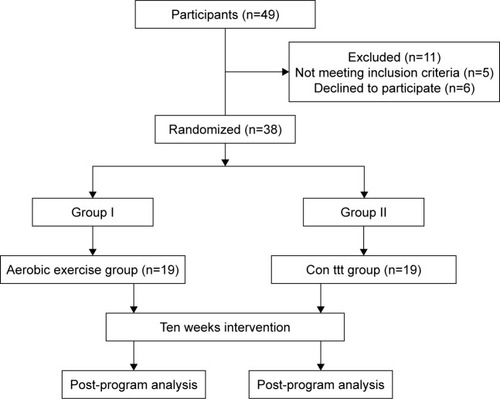
Table 1 Baseline characteristics of all children participating in this study
Table 2 Pre- and post-treatment mean differences of BMI, lung functions, aerobic capacity, and HRQoL within each group
Table 3 Mean differences of BMI, lung functions, aerobic capacity, and HRQoL between the two groups pre- and post-treatment
Table 4 Gender differences in the pre- and post-treatment mean values of BMI, lung functions, aerobic capacity, and HRQoL in the AE and Con groups