
Figures & data
Table 1 Observation steps
Figure 1 Experimental setup with the injection device.
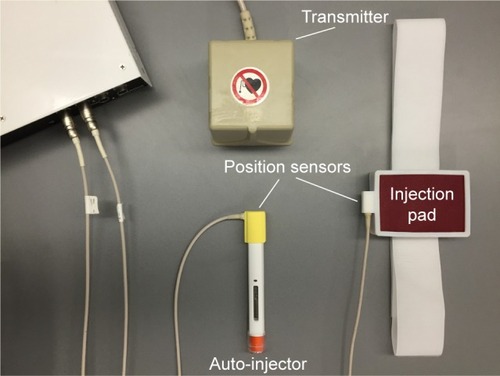
Figure 2 Virtual fiducials used for calibration.
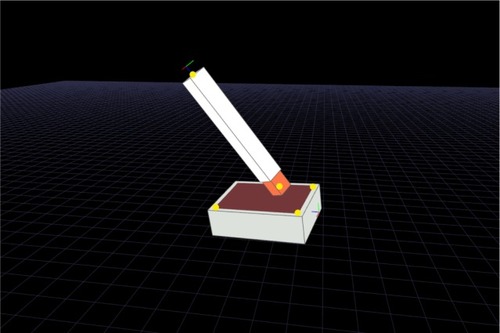
Table 2 Survey questionnaire
Figure 3 The state of the auto-injector when fully inserted into skin.
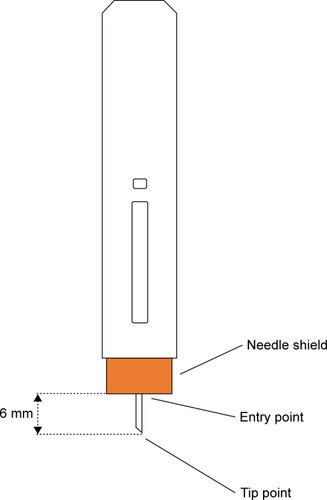
Figure 4 An illustration for calculating the needle displacements of the entry point and the tip point (de, dt) from the initial pose (pe, pt) to the adjusted current pose (pe″, pt″). (pe′, pt′) is the original current pose.
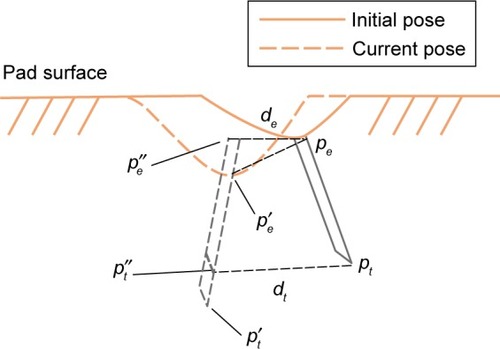
Figure 5 Comparison of max needle displacement between the healthy group and the RA group based on thigh and abdomen measurements.
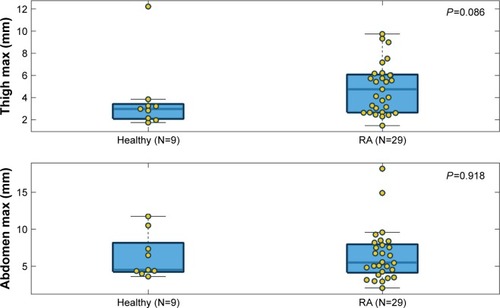
Figure 6 Comparison of mean needle displacement between the healthy group and the RA group based on thigh and abdomen measurements.
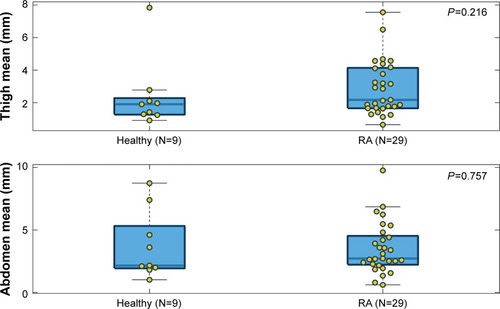
Figure 7 Comparison of SD of needle displacement between the healthy group and the RA group based on thigh and abdomen measurements.
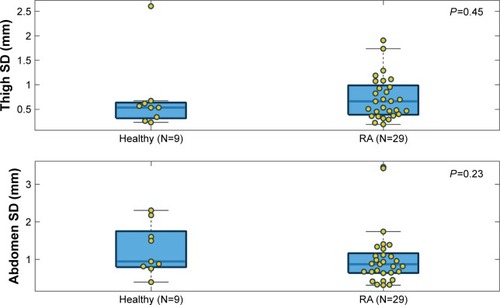
Figure 8 Comparison of mean needle displacements between subgroups in RA subjects.
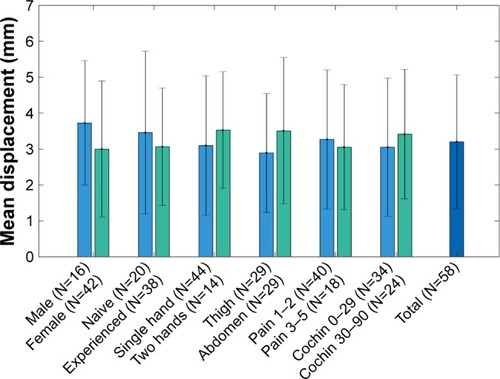
Figure 9 Comparison of mean needle displacement with or without gloves.
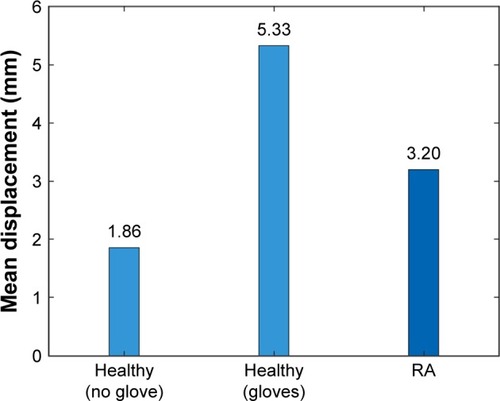
Figure 10 Needle displacement at every 1/60 second for each subject, split by injection site.
Abbreviation: RA, rheumatoid arthritics.
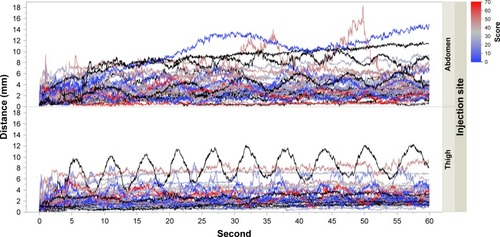
Figure 11 Maximum distance reached up to time t.
Abbreviation: RA, rheumatoid arthritics.
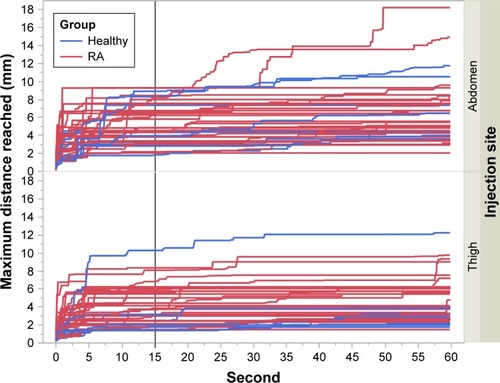
Table 3 Percentage of subjects who reached a given percentile of their distance at 15 seconds
Figure 12 Maximum distance reached at 15, 30, 45, and 60 seconds per subject.
Abbreviation: RA, rheumatoid arthritics.
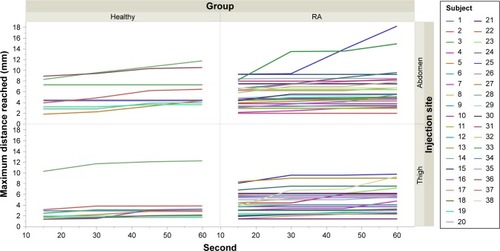
Table 4 Overall device acceptance
Table 5 Device acceptance in RA group