
Figures & data
Table 1 Final health states
Table 2 Example health state
Table 3 Sociodemographic and EQ-5D-5L results
Figure 1 Mean TTO utility scores for each PAH health state.
Notes: *p-value vs oral health state; p<0.001; mixed model F = 92.4, p<0.001.
Abbreviations: PAH, pulmonary arterial hypertension; SD, standard deviation; TTO, time trade-off.
Abbreviations: PAH, pulmonary arterial hypertension; SD, standard deviation; TTO, time trade-off.
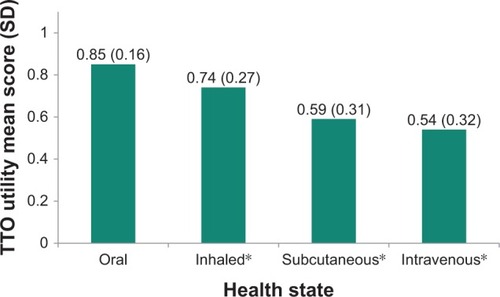
Figure 2 Mean VAS utility scores for each PAH health state.
Notes: *p-value vs oral health state; p<0.001; mixed model F = 326.5, p<0.001.
Abbreviations: PAH, pulmonary arterial hypertension; SD, standard deviation; VAS, visual analog scale.
Abbreviations: PAH, pulmonary arterial hypertension; SD, standard deviation; VAS, visual analog scale.
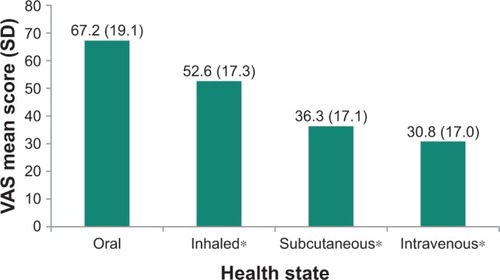
Figure 3 Mean disutilities of TTO utility scores for each non-oral vs oral PAH health state.
Notes: *p-value vs oral health state; p<0.001.
Abbreviations: PAH, pulmonary arterial hypertension; SD, standard deviation; TTO, time trade-off.
Abbreviations: PAH, pulmonary arterial hypertension; SD, standard deviation; TTO, time trade-off.
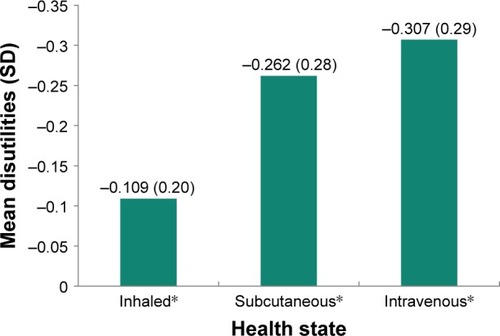
Table 4 Results from the univariable and multivariable mixed effects regression models of TTO utility scores, with p-values significant at p<0.05 indicated in bold