
Figures & data
Table 1 Predictors of subsequent visit after the first treatment interruption
Figure 1 Flowchart of this study.
Abbreviation: MDE, major depressive episode.
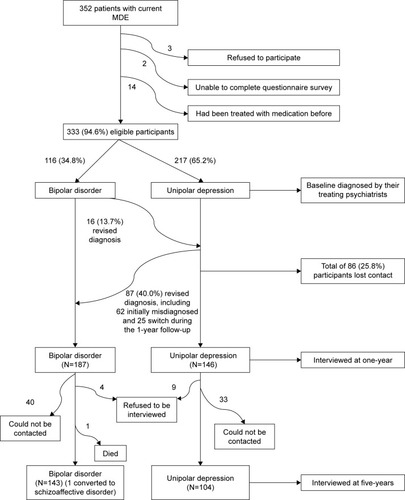
Table 2 Pattern of medication persistence in the first period of treatment
Figure 2 TLP1 for all the participants.
Abbreviation: TLP1, time to lack of persistence in the first episode of treatment.
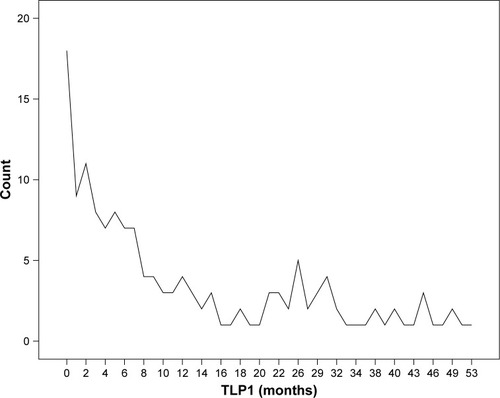
Figure 3 TLP2 for all the participants.
Abbreviation: TLP2, time to lack of persistence in the second episode of treatment.
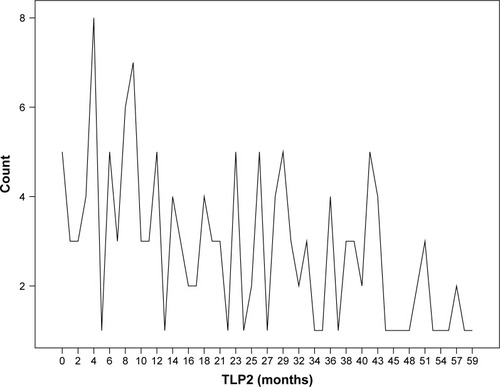
Table 3 Comparison of TLP between the first and the second episode of treatment
Figure 4 Five-year outcome of UD patients.
Note: 1=full remission, 2=partial remission, 3=recurrence or relapse, 4=chronicity, 5=dead.
Abbreviation: UD, unipolar depression.
Abbreviation: UD, unipolar depression.
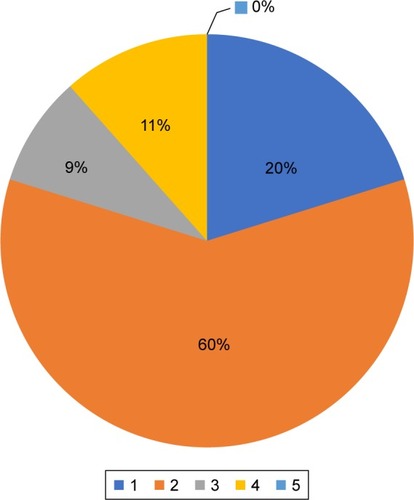
Figure 5 Five-year outcome of BD patients.
Note: 1=full remission, 2=partial remission, 3=recurrence or relapse, 4=chronicity, 5=dead.
Abbreviation: BD, bipolar disorder.
Abbreviation: BD, bipolar disorder.
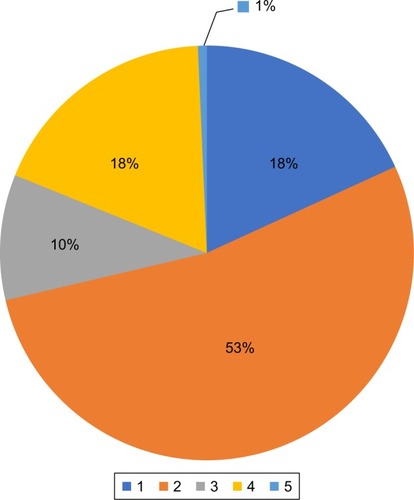
Table 4 Association of NTI with 5-year outcome