Figures & data
Figure 1 Consort diagram.
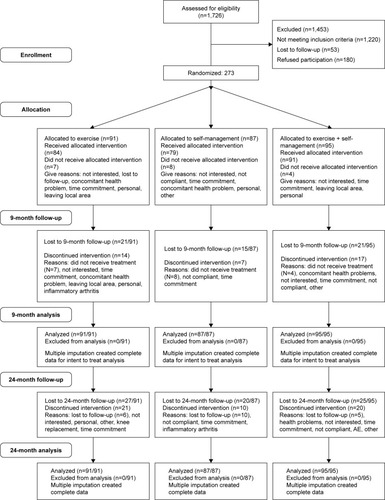
Table 1 Item maps for composite measures of promotion and prevention
Figure 2 Path model with standardized parameter estimates of significant paths.
Notes: Solid lines represent significant paths. Dashed lines represent nonsignificant paths.
Abbreviations: Pre, prevention orientation; Pro, promotion orientation; Comp, changes in compliance; SE, changes in self-efficacy; Func, changes in functioning.
Abbreviations: Pre, prevention orientation; Pro, promotion orientation; Comp, changes in compliance; SE, changes in self-efficacy; Func, changes in functioning.
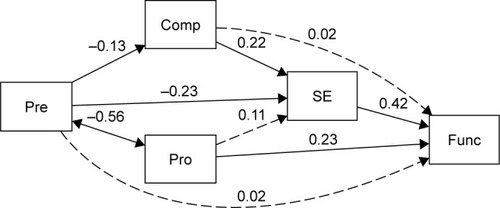
Table 2 SEM parameters and statistics
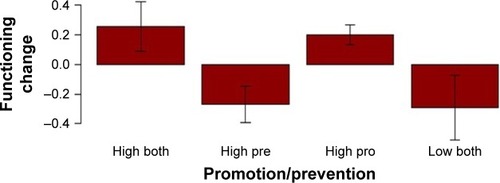
Figure 3 Percentage of participants with improved functioning by median-split promotion/prevention classification profiles.
Note: Bars below 0.0 indicate more participants in this group decreased in functioning than increased in functioning.
Abbreviations: Pre, prevention; Pro, promotion; Both, prevention and promotion.
Abbreviations: Pre, prevention; Pro, promotion; Both, prevention and promotion.