Figures & data
Figure 1 Prisma flow diagram for included studies.
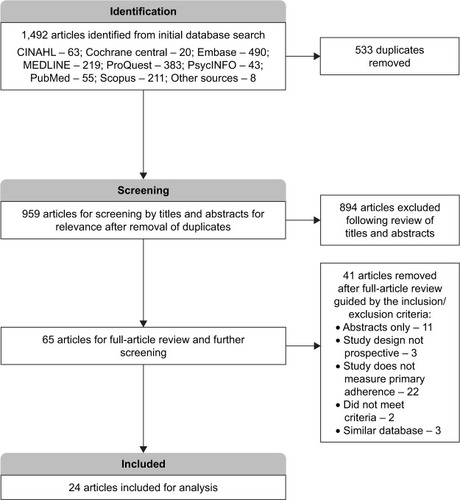
Table 1 Description of included studies
Figure 2 (A) Risk-of-bias plot – experimental studies. (B) Risk-of-bias plot – observational studies.
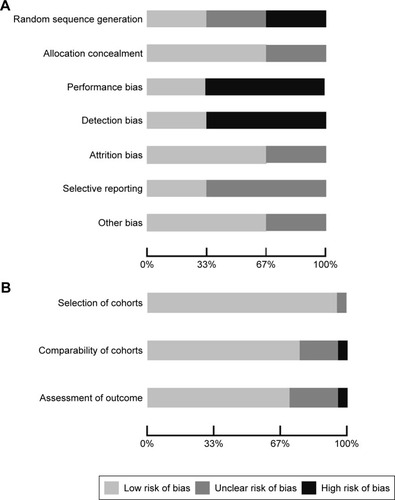
Table 2 Pooled estimates
Table 3 Subgroup analysis
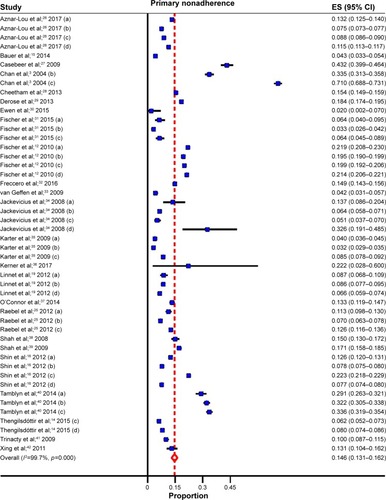
Figure 3 Forest plot for primary medication nonadherence.
Notes: (a) hypoglycemics; (b) anti-hypertensives; (c) lipid-lowering; (d) anti-depressants.
Abbreviation: ES, effect size.
Abbreviation: ES, effect size.