
Figures & data
Figure 1 Structure of tree obtained using CART with minsplit = 100.
Notes: At each node, the split is written as x.j < a (top), and the mean score predicted at this node is given (bottom). Observations that satisfy the splitting rule are sent to the left child node.
Abbreviation: CART, classification and regression tree.
Abbreviation: CART, classification and regression tree.
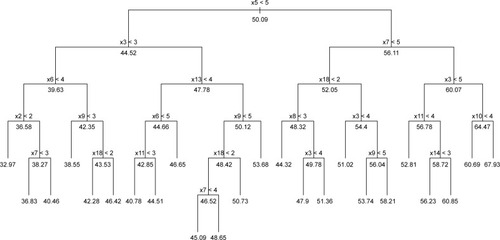
Figure 2 IRT-based computerized adaptive test algorithm.
Abbreviation: IRT, item response theory.
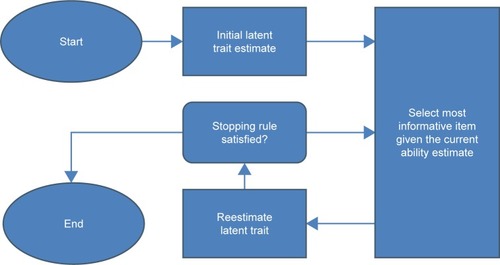
Table 1 Comparisons of DRT- and IRT-based approaches
Table 2 Comparison of DRT-based CAT score with sociodemographic, clinical and QoL data
Figure S1 Cross-validation results (1,000 replicates, 200 values of minsplit).
Note: (A) The number of items in function of minsplit, (B) the correlation in function of minsplit, (C) RMSE in function of minsplit.
Abbreviation: RMSE, root mean square error.
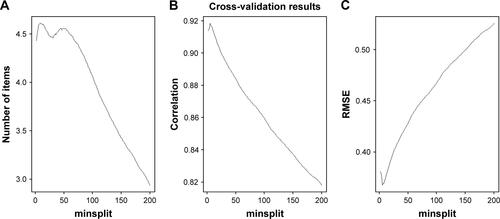
Table S1 Cross-validation results for the DRT-based approach