
Figures & data
Figure 1 Framework of HSR, vignette example, and vignette ordering by investigators.
Abbreviation: HSR, health system responsiveness.
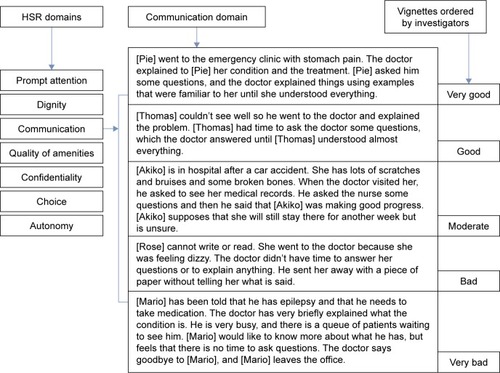
Figure 2 Framework of measurement and analysis about HSR experience and vignettes.
Abbreviation: HSR, health system responsiveness.
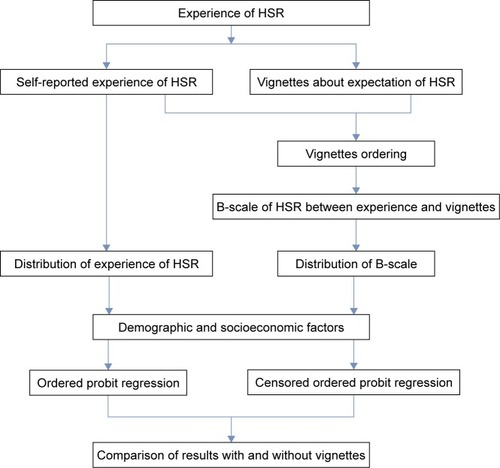
Table 1 Clinical status among HIV-positive patients
Table 2 Distribution and ordered probit regression results of experience of HSR before and after adjusting for sociodemographic factors among HIV-positive and non-HIV patients
Table 3 COPR results for experience and vignettes of HSR before and after adjusting for sociodemographic factors among HIV-positive and non-HIV patients