
Figures & data
Table 1 The three BRASS risk categories
Figure 1 Bland–Altman plot differences in values assigned during compilation of the BRASS questionnaire vs the average score.
Abbreviation: BRASS, Blaylock Risk Assessment Screening Score.
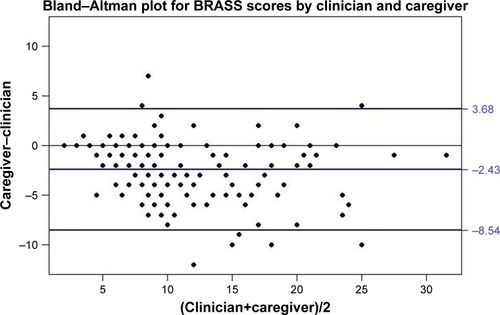
Table 2 Agreement between the values assigned by the clinicians and the caregivers on BRASS questionnaire
Table 3 Joint distribution of the overall BRASS score assigned by the doctors and the caregivers (KW=0.69)
Table 4 Joint distribution of the BRASS score assigned by the doctors and the caregivers for social, cognitive, and mobility status