
Figures & data
Table 1 Patients’ demographics and disease conditions
Table 2 Comparison of cellular immune indices and psychological indicators of patients at admission, after 14 days, and after 3 months
Table 3 The effects of demographics and disease on the patients’ NK activity
Table 4 The correlations among doctors’ empathy and patients’ stigma, self-efficacy, anxiety, and NK subset
Figure 1 The model of relationships among doctors’ empathy abilities and patients’ stigma, self-efficacy, anxiety, and NK subset.
Abbreviations: MIPA, maintaining independence and positive attitude; PMC, participating in medical care; CSM, coping and stress management; MA, managing affect; SPS, standing in the patient’s shoes; PK, perspective taking; CC, compassion care; SR, social rejection; FI, financial insecurity; IS, internalized shame; SI, social isolation.
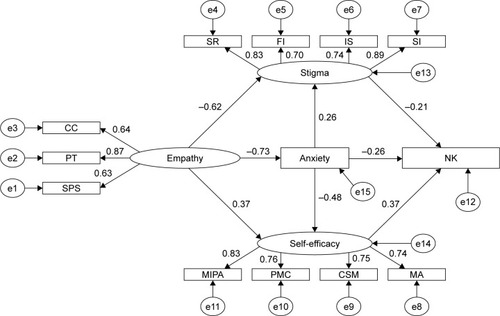
Table 5 Normalized path coefficients
Table 6 Bootstrap indirect effects analysis of nonparametric ratios
Table 7 Direct effects of doctors’ empathy on patients’ NK activity