
Figures & data
Figure 1 Patients’ main reasons for choosing the hospital.
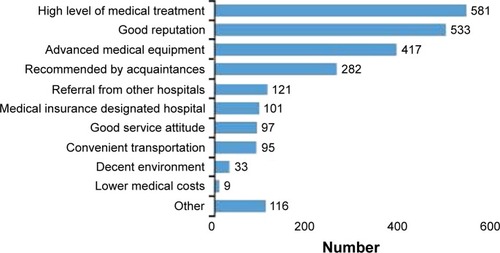
Figure 2 Patients’ most unsatisfactory items regarding hospital services.
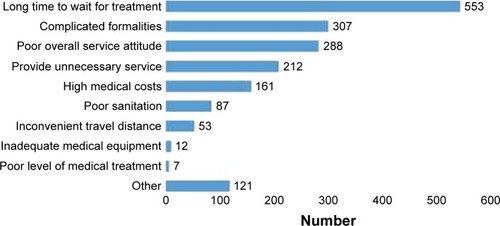
Table 1 Demographic information of the participants (N=844)
Table 2 Logistic regression analysis of influencing factors associated with patient satisfaction (for lowest score group)
Table 3 Logistic regression analysis of influencing factors associated with patient satisfaction (for highest score group)