Figures & data
Figure 1 Patient disposition.
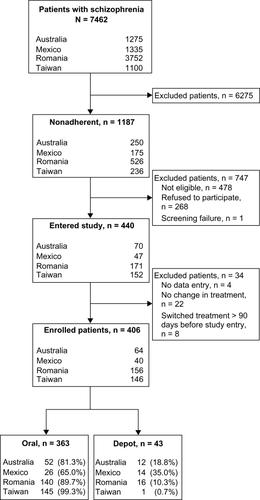
Table 1 Antipsychotic switch patterns at study entry
Figure 2 Twelve-month Kaplan–Meier survival curve (n = 406) for all cause treatment discontinuation (event, n = 99; censored, n = 307). Time to discontinuation was calculated from the date of study entry to the date of the first all cause treatment discontinuation. For the survival analyses, patients were censored if they had not switched, augmented, or discontinued their antipsychotic medication at 365 days, if they had completed the study, or if they discontinued from the study for any reason. Censored patients are denoted by •. Median Kaplan–Meier estimates could not be calculated because the proportion of patients who had changed their medication during the study did not reach 50% at 12 months.
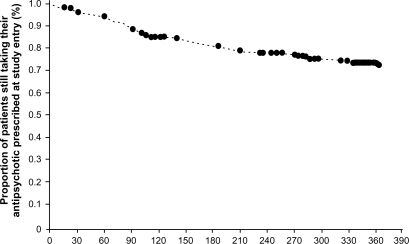
Table 2 Reasons for all cause treatment discontinuation
Table 3 Antipsychotic medication use patterns for all cause treatment discontinuation
Table 4 Change in illness severity, attitude to antipsychotic medication, and quality of life scores