
Figures & data
Figure 1 The decision-tree model which was based on the qualitative interviews in stage A.
Abbreviations: N, no; Y, yes; C, compliant; NC, noncompliant; SC, sometimes compliant.
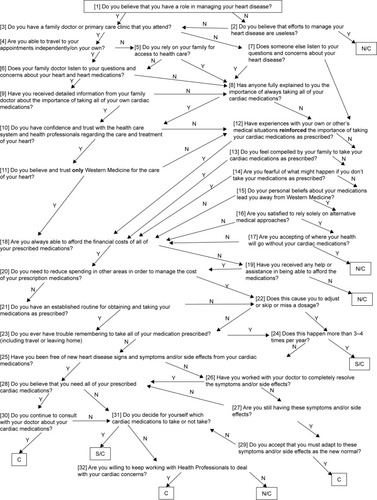
Table 1 Demographic characteristics of 286 stage C participants
Table 2 Factors significantly related to the model outcomes by ethnicityTable Footnotea
Table 3 How ethnicity affected question responseTable Footnotea
Table 4 Self-report and actual model outcomes