
Figures & data
Figure 1 Perceived burden of side effects on a visual analog scale (VAS, 0–100).
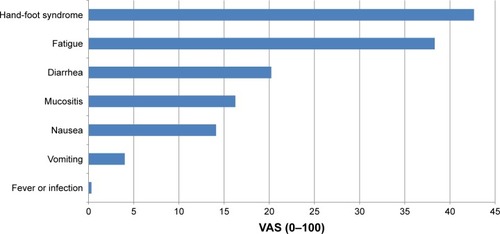
Table 1 Sociodemographic and medical characteristics of outpatients receiving capecitabine (n=64)
Figure 2 Participant satisfaction with information received (Satisfaction with Information about Medicines Scale, n=64).
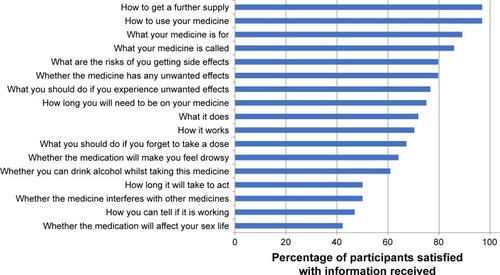
Table 2 Correlations between adherence and sociodemographic and medical variables (n=64) using Mann–Whitney U-test
Table 3 Correlations between adherence and sociodemographic and medical variables (n=64) using Fishers exact test
Table 4 Logistic regression model on adherence with sum scores as predictors. Nagelkerke’s R2.291
Table 5 Logistic regression model on adherence with subscores as predictors. Nagelkerke’s R2.309
Figure S1 Participant satisfaction with Patient–Doctor relationship (PDRQ-9, n=64).
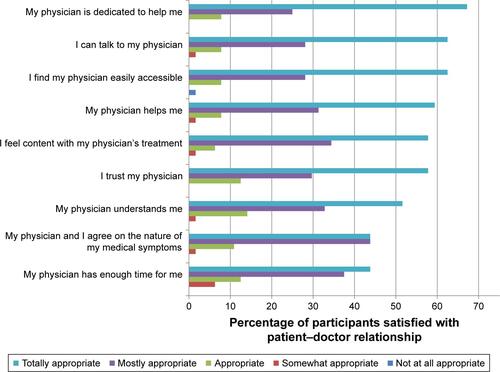
Figure S2 Participant reported necessities of capecitabine therapy (Beliefs about Medicines Questionnaire – Necessity Scale, n=64).
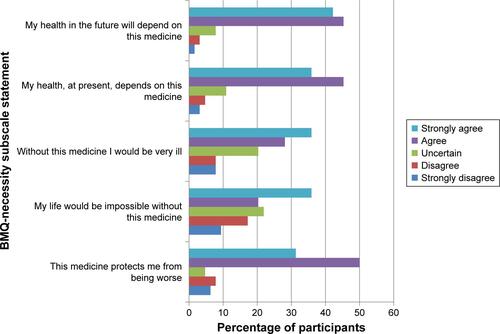
Figure S3 Participant reported concerns of capecitabine therapy (Beliefs about Medicines Questionnaire – Concerns Scale, n=64).
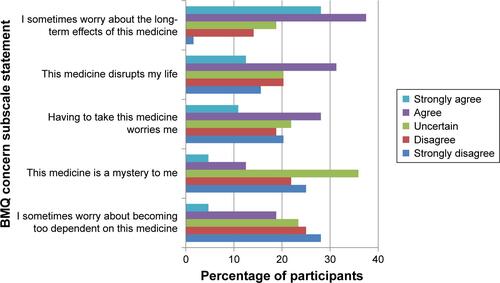
Table S1 Single items of the Patient–Doctor Relationship Questionnaire (PDRQ-9, n=64)
Table S2 Self-reported adherence to capecitabine (n=64)